The Scenario
Imagine standing by a murky stream. You notice objects floating passed you. Pulling out your notebook, you write down for each object how confident you are that it is a fish (between 0.0 and 1.0). Not all are fish with some pieces being trash. Downstream, your friend scoops up each object and writes down what it actually is.
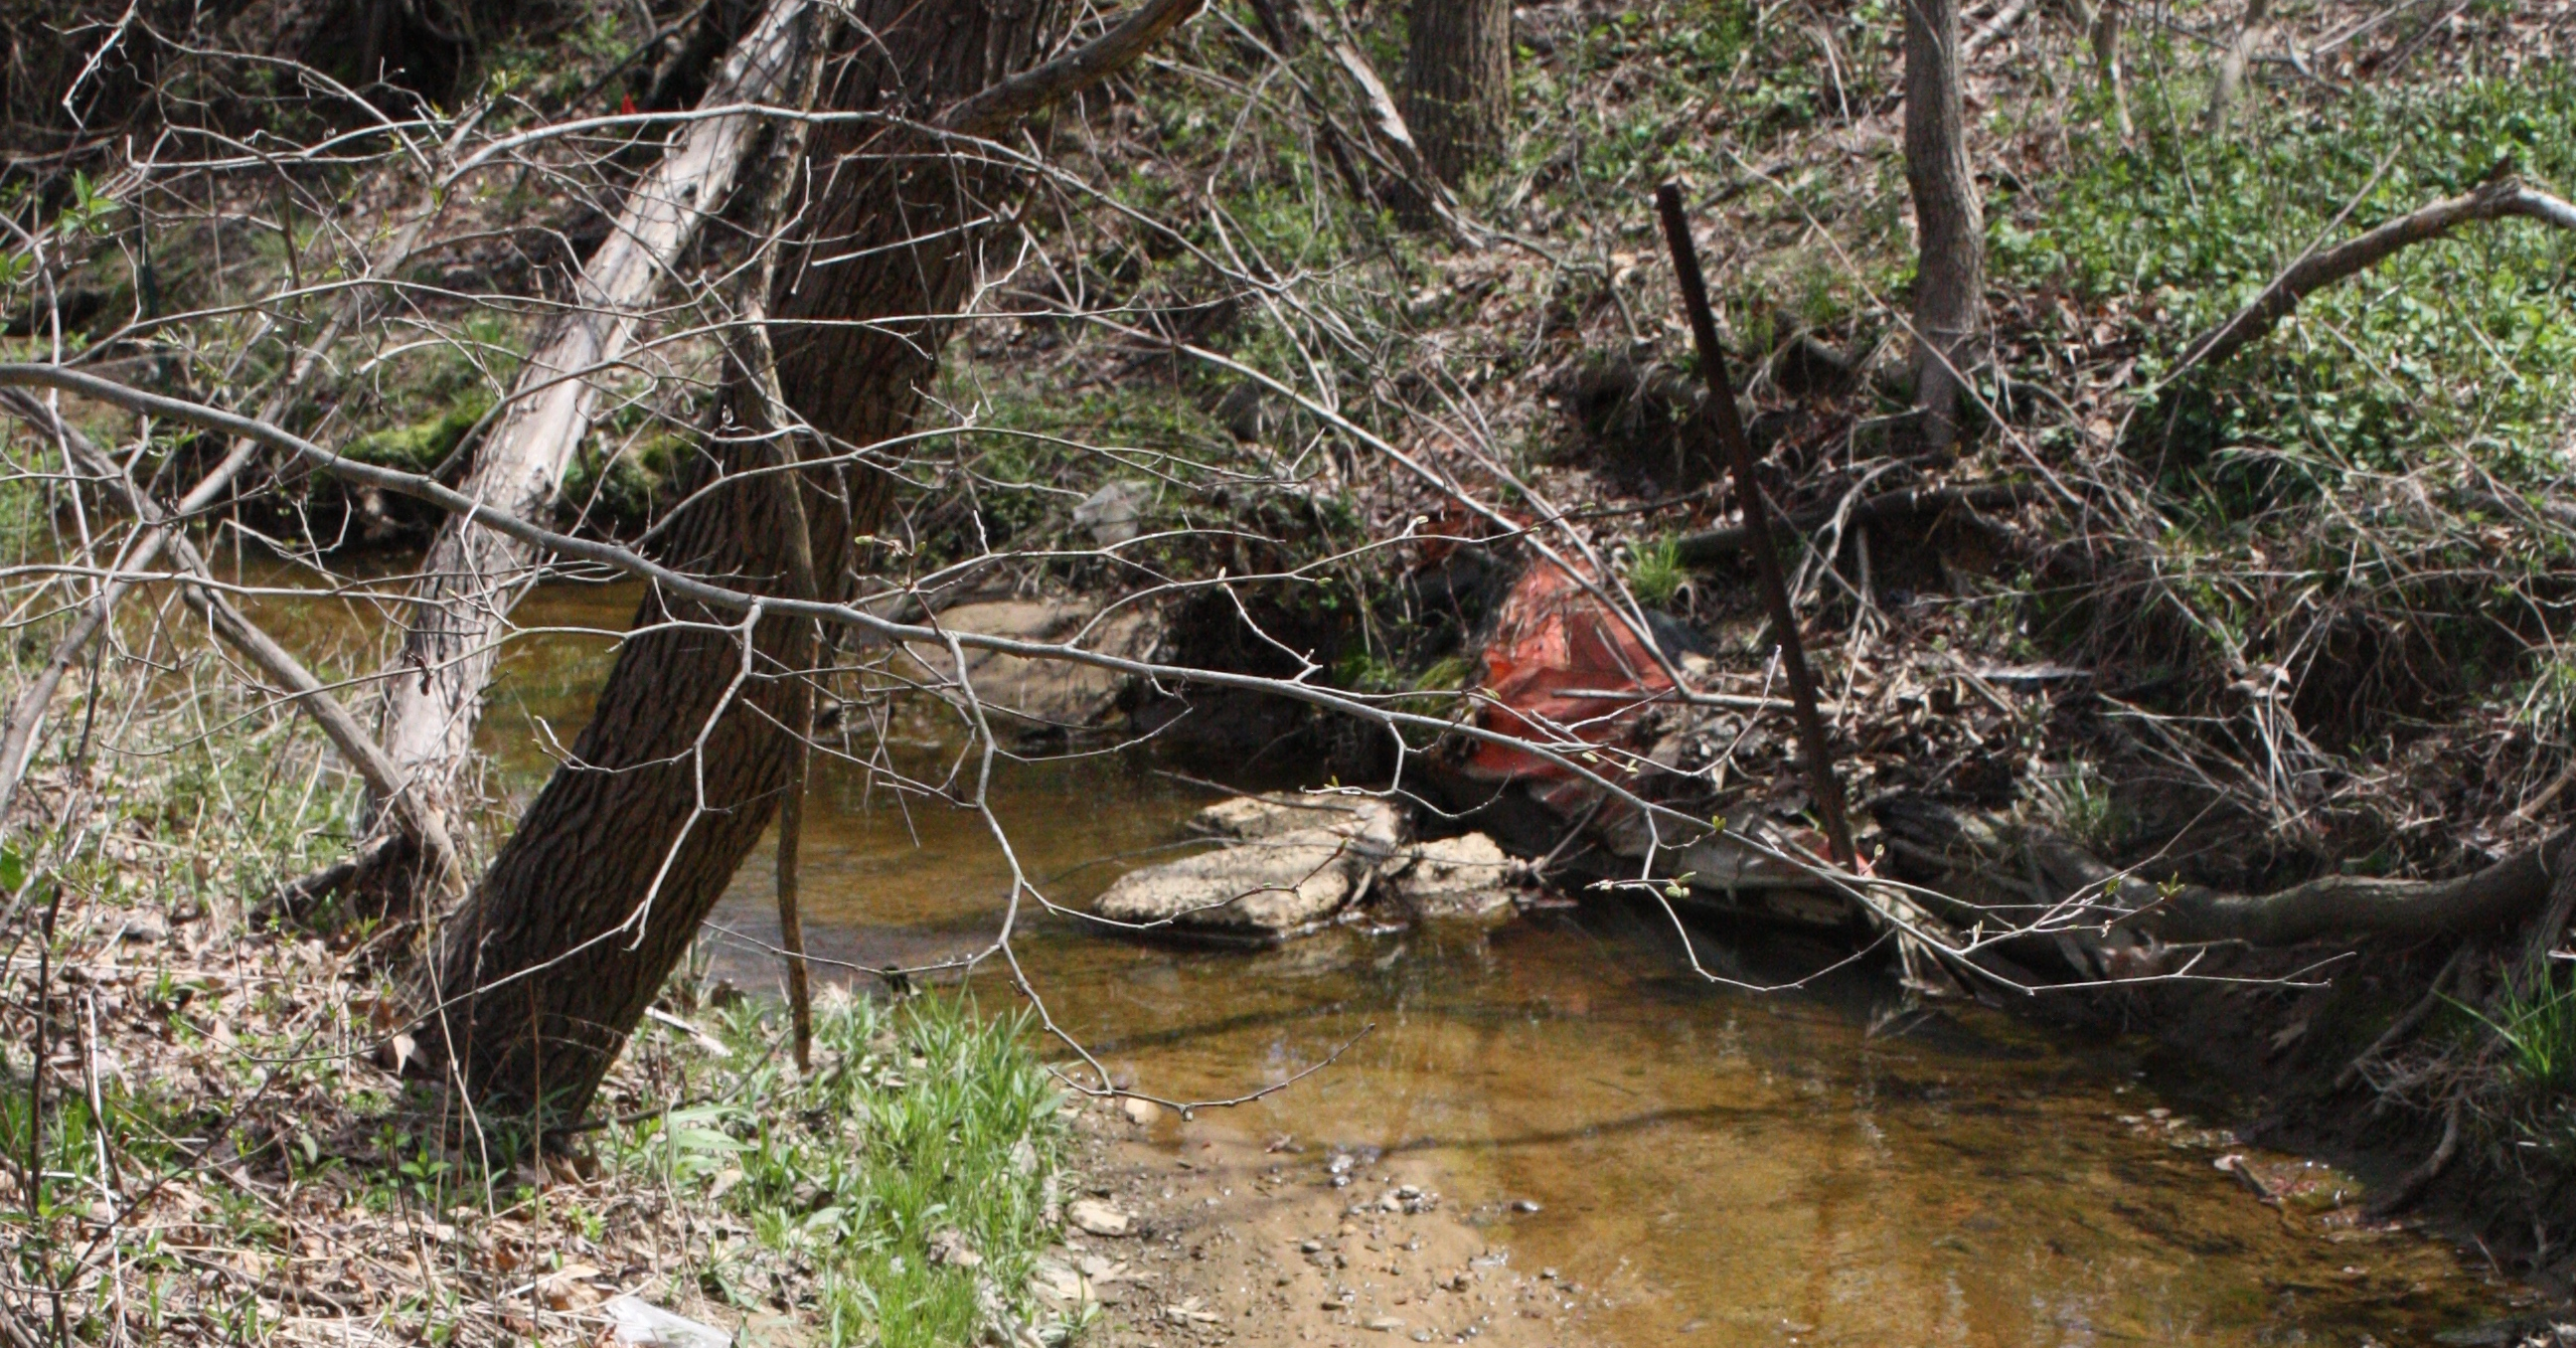
The Murky Stream
Thresholds
In this sense you are a binary classifier capable of classifying an object in the stream as either class fish or not class fish (class trash) but more importantly you give the class probabilities for each classified object. Since your friend has the actual classes of the objects, we can see how well you separated the classes.
| Class Fish Probability | Actual Fish | Actual Trash |
|------------------------|-------------|--------------|
| 0.0                    |         0   |         11   |
| 0.1                    |         0   |         10   |
| 0.2                    |         0   |         12   |
| 0.3                    |         1   |          9   |
| 0.4                    |         2   |          8   |
| 0.5                    |         6   |          7   |
| 0.6                    |         8   |          5   |
| 0.7                    |        10   |          1   |
| 0.8                    |        20   |          1   |
| 0.9                    |        22   |          0   |
| 1.0                    |        23   |          0   |
|------------------------|-------------|--------------|-----|
| Totals                 |        92   |         64   | 156 |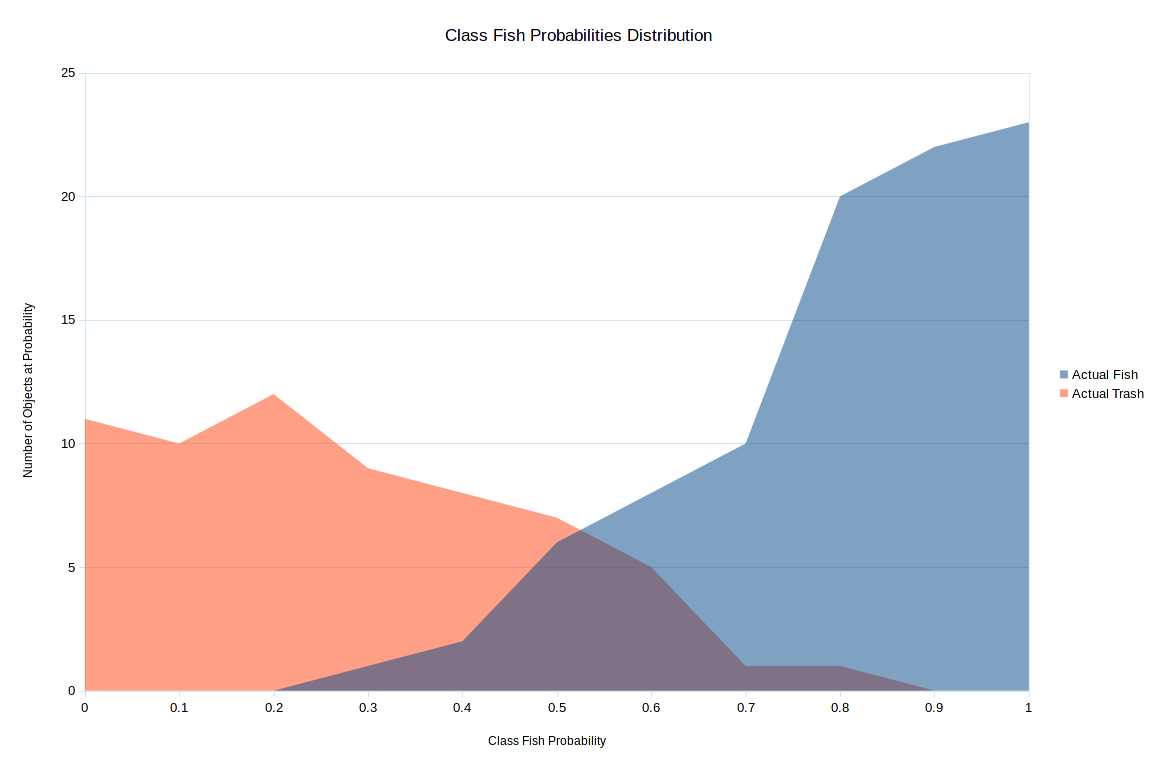
Class Fish Probabilities Distribution
So for all the objects that you said 0.0, zero were fish and 11 were trash. For each one you said was 0.7, 10 were fish and one was trash.
The goal now is to set a threshold such that if your gut feeling is >= you call out fish, otherwise you yell out not fish. This will make it easier on your downstream friend. Based on fish or not fish, they can quickly clean up the stream, scooping out the trash. After all, they have to make a decision to scoop or not and working with thresholds makes this harder versus a binary decision.
Say you set the threshold at 0.6, then the following would be your prediction contingency table.
                  | Actual Fish | Actual Trash | Totals |
|-----------------|-------------|--------------|--------|
| Predicted Fish  | 83 (TP)     |  7 (FP)      | 90     |
| Predicted Trash |  9 (FN)     | 57 (TN)      | 66     |
|-----------------|-------------|--------------|--------|
| Totals          | 92          | 64           | 156    |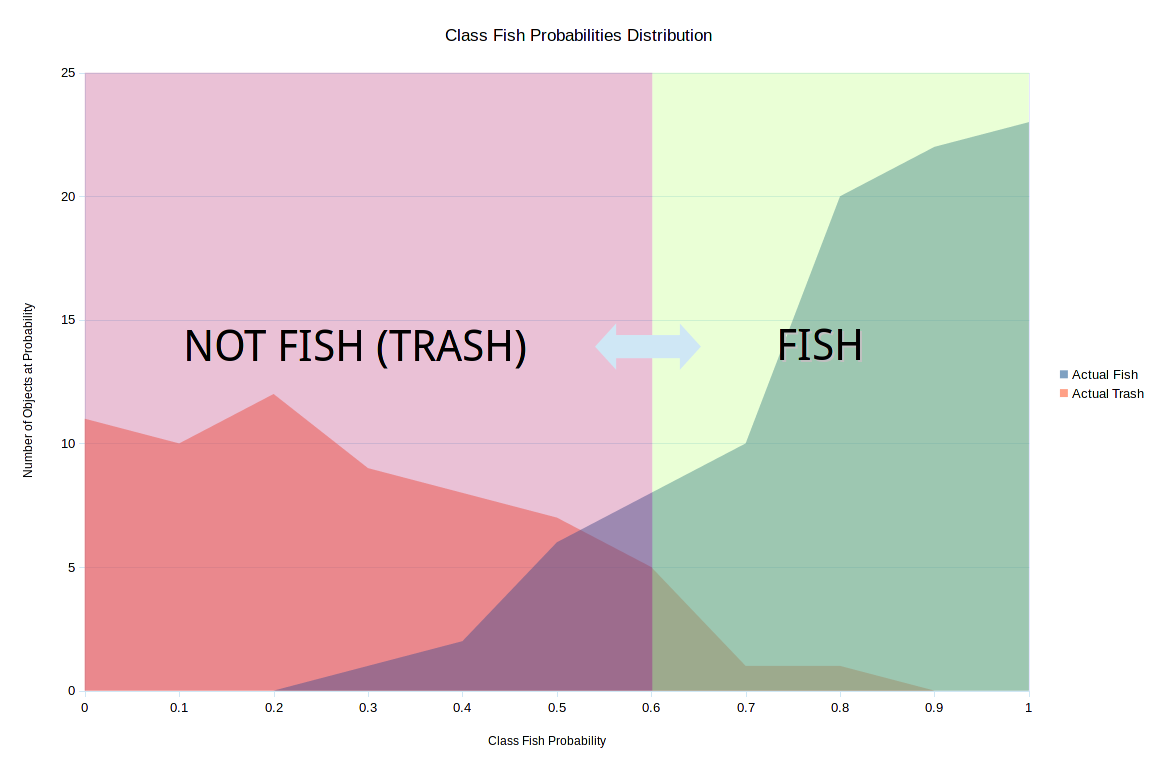
Threshold set a 0.6
TPR and FPR
To get our point on the ROC curve, we need to calculate the true positive rate (TPR) and the false positive rate (FPR).
| Class Fish Probability | Actual Fish (FN) | Actual Trash (TN) |
|------------------------|------------------|-------------------|------------|
| 0.0                    |         0        |         11        |            |
| 0.1                    |         0        |         10        |            |
| 0.2                    |         0        |         12        | "Not Fish" |
| 0.3                    |         1        |          9        |            |
| 0.4                    |         2        |          8        |            |
| 0.5                    |         6        |          7        |            |
|------------------------|------------------|-------------------|------------|
| Class Fish Probability | Actual Fish (TP) | Actual Trash (FP) |
|------------------------|------------------|-------------------|------------|
| 0.6                    |         8        |          5        |            | <-- Threshold
| 0.7                    |        10        |          1        |            |
| 0.8                    |        20        |          1        |  "Fish"    |
| 0.9                    |        22        |          0        |            |
| 1.0                    |        23        |          0        |            |
|------------------------|------------------|-------------------|------------|
| Totals                 |        92        |         64        |
For threshold 0.6:
TPR = TP / TP + FN = 83 / (83 + 9) = 83 / 92 = 0.9021739130434783
FPR = FP / FP + TN = 7 / (7 + 57) = 7 / 64 = 0.109375ROC Curve
To complete the curve we will need to calculate this for each class fish probability you called out.
| Class Fish Probability | TPR  | FPR  |
|------------------------|------|------|
| 0.0                    | 1    | 1    |
| 0.1                    | 1    | 0.82 |
| 0.2                    | 1    | 0.67 |
| 0.3                    | 1    | 0.48 |
| 0.4                    | 0.98 | 0.34 |
| 0.5                    | 0.96 | 0.21 |
| 0.6                    | 0.90 | 0.10 |
| 0.7                    | 0.81 | 0.03 |
| 0.8                    | 0.70 | 0.01 |
| 0.9                    | 0.48 | 0    |
| 1.0                    | 0.25 | 0    |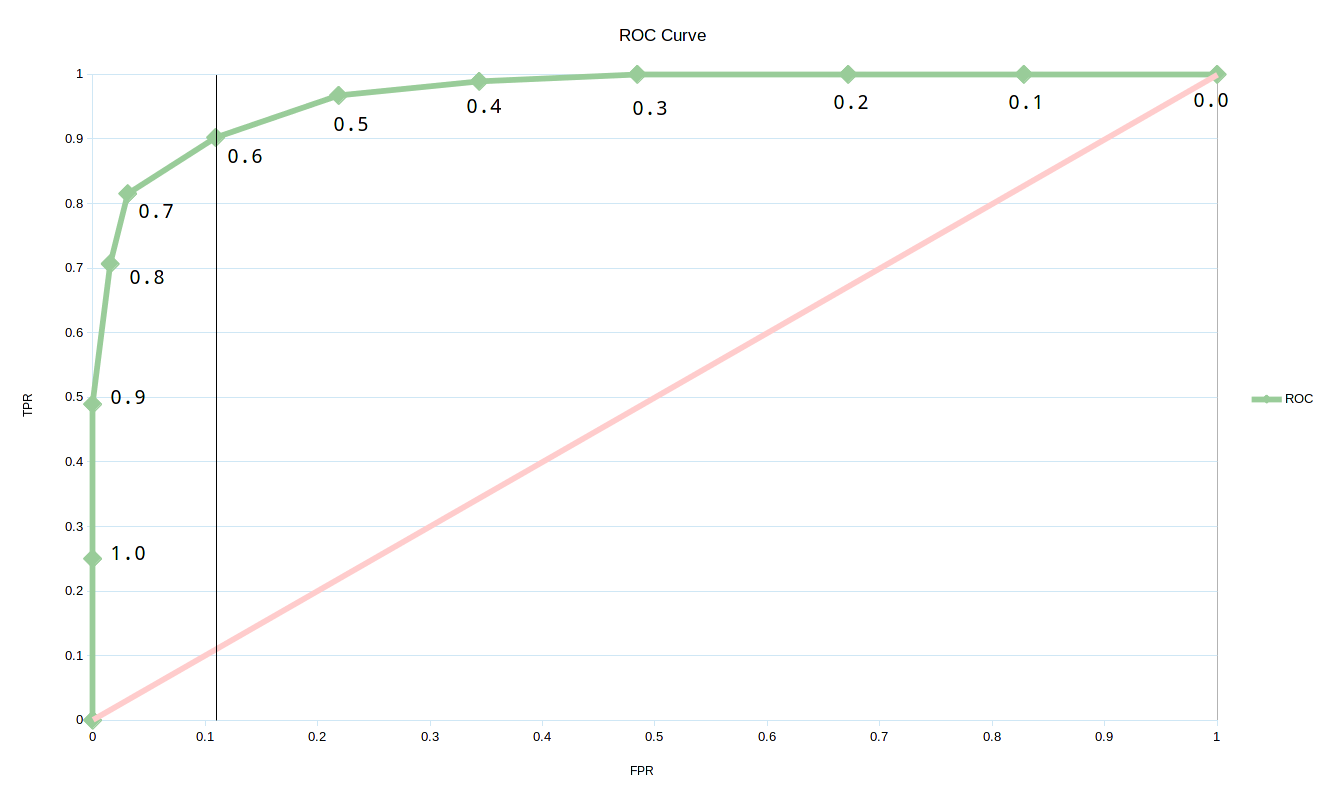
ROC Curve
If you set 0.0 as the threshold then you would label every object in the stream as a fish. This wouldn’t be very useful but you would get all of the true positives but would also get all of the false positives (64 in total for the recording period). With 0.0 being the threshold, all of the fish would be left in the stream but so would all of the trash.
Setting the threshold to 1.0, you would rarely call out fish unless you were 100% certain. Of course when you did yell out fish, you would probably never be wrong resulting in no false positives. However, you would miss most of the true positives resulting in most of the fish and trash being taken out of the stream. In other words, since you barely ever call out fish, your friend downstream assumes almost everything floating down is trash. Going with 1.0 would suffocate a lot of fish but would get most if not all of the trash.
Based on the curve, the best threshold turns out to be 0.6 such that if you are >= 60% sure you call out fish. Notice that the 0.6 threshold point on the ROC curve is the closest to (0.0 FPR, 1.0 TPR)—a perfect classifier capturing all of the true positives and making no false positives.
Recap
Coming up with a fake scenario, we built up a binary classification problem. We discussed the ROC curve charting the FPR vs TPR trade offs at various threshold levels of class probability. Looking at the curve, we picked the best threshold for the best classifier.