311 Complaints
Found among NYC’s OpenData is the 311 service requests from 2010 to present data set.
In New York City, 311 is used by city officials as one of several sources of measurement and information about the performance of city services. Important dates in the history of New York’s 311 service include December 20, 2005, when it received its record high of 240,000 calls, due to the first day of the 2005 New York City transit strike, and June 20, 2007, when it received its 50 millionth call.
This data set contains a varied amount of complaint types ranging from Blocked Driveway to Noise - Residential. Using the SODA API we will collect 2,678 public complaints created between 2010-01-01T04:49:33 and 2016-05-29T18:22:54.
Over Time
One way to analyze the data is to chart/plot the complaints as they occurred over time. To do this, we will be using the Haskell Chart library.
Bucketed by the Day
For the first chart we will bucket the created_dates by the day such that if we had 2010-01-01T04:49:33 and 2010-01-01T08:32:12 they would both fall into the 2010-01-01T00:00:00 bucket. With every complaint bucketed, we will count up the amount of complaints in each day bucket. These counts will then be charted over time.
Line Chart
We will visualize the day buckets using a line chart.
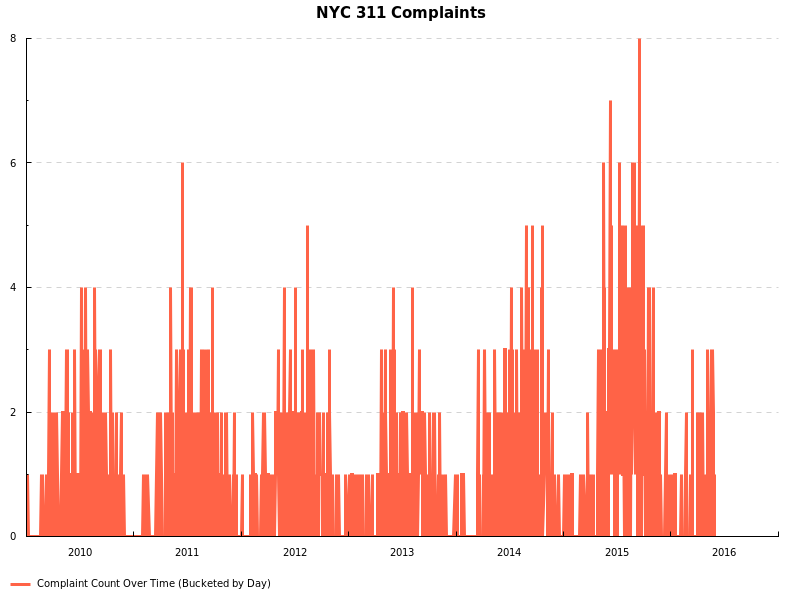
Immediately you can see a large spike around September in the late summer of 2015. With the exception of 2011, you can see similar late summer spikes for 2010, 12, 13, and 14. There are also large falloffs occurring at the end and beginning of each year during the winter months.
Bucketed by the Month
To add some clarity, we will now bucket the complaints by month. We will bucket them in such a way that if we had 2010-01-13T04:49:33 and 2010-01-18T08:32:12 they would both fall into the 2010-01-01T00:00:00 bucket. In other words, each event per year and month will fall on the first of its month.
Line Chart
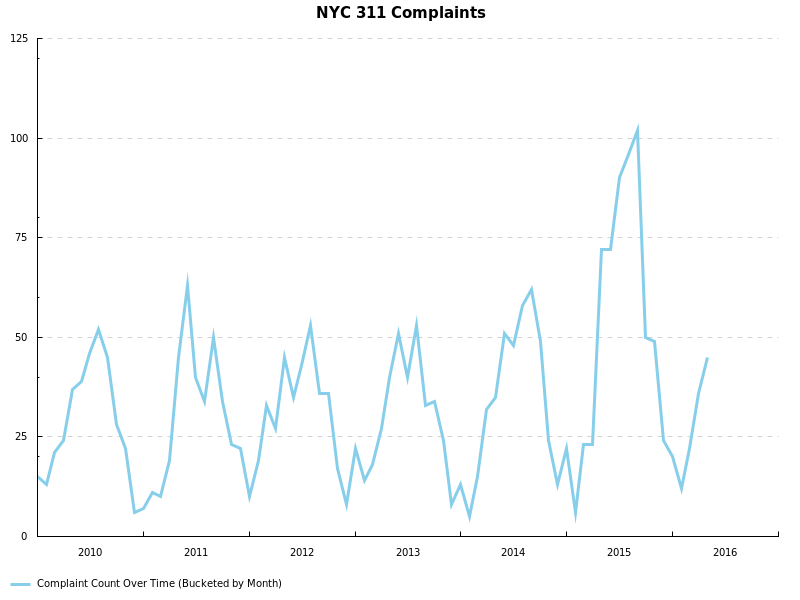
You can see the line follows the same overall shape as the line chart bucketed by day. The counts are higher since all events that occurred in any particular month are now reported in aggregate for that month. By bucketing each complaint by the month it occurred in, we can more clearly see the spikes. Notice that the same late summer spikes are still present. 2011 breaks the pattern with it spiking earlier in the year with a smaller spike occurring later.
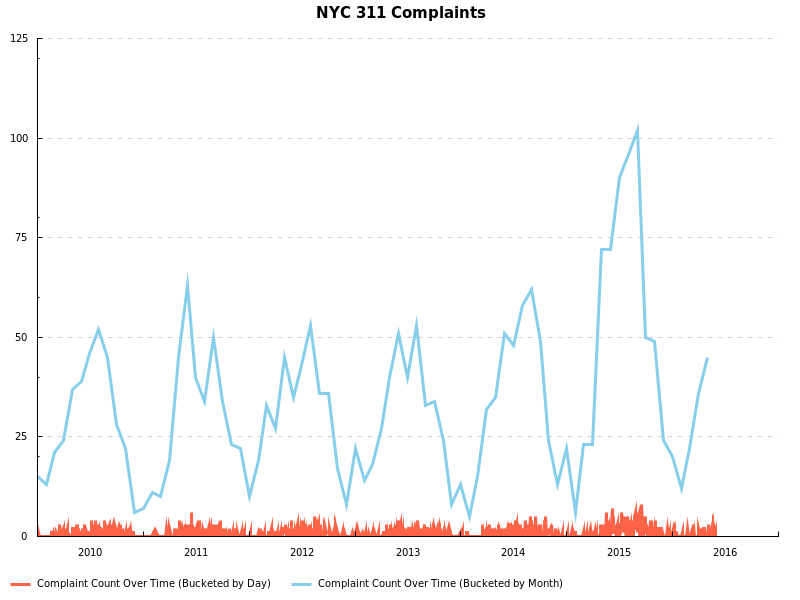
Here we see both the bucketed by day and month charted together.
Bar Chart
Alternatively, we can truncate the created_date time stamps to YYYY-MM and bucket each complaint by their truncated dates. For these buckets, we will use a bar chart. Since we will be sorting the buckets numerically by their year-month labels, we can view the bar chart as a histogram (the labels are quantitative vs categorical).
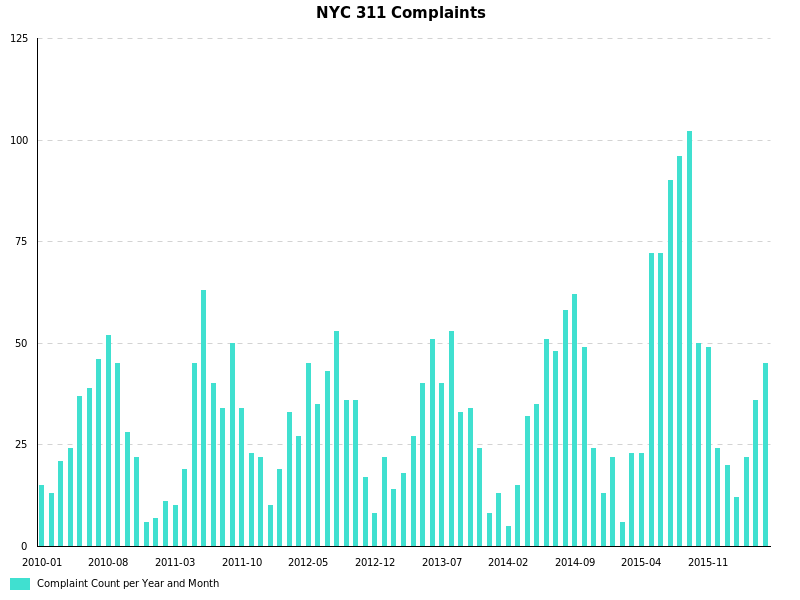
Again, we see the same spikes and falloffs.
By Borough
Another way to visualize the data is to look at them by borough. New York City is made up of five boroughs.
New York City is often referred to collectively as the five boroughs; the term is used to refer to New York City as a whole unambiguously, avoiding confusion with any particular borough or with the Greater New York metropolitan area.
Total Aggregate Count
We will go ahead and plot a bar chart where each category is a borough and its value is how many complaints were reported as belonging to that borough (over the ~6 year span).
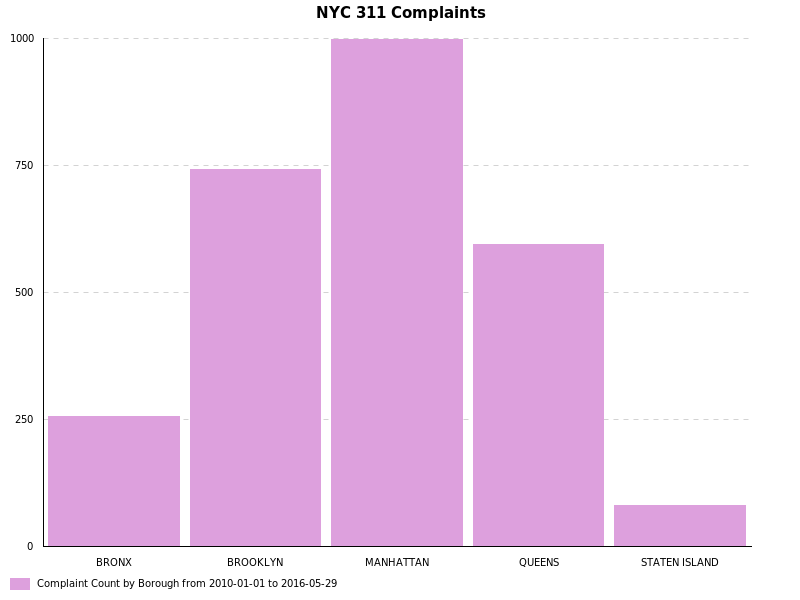
We can see that Manhattan had the most with Brooklyn, Queens, the Bronx, and Staten Island coming in at second, third, and four respectively.
Borough Population Sizes
To make the borough counts more interesting we will also chart their population sizes. The U.S. Census Bureau estimated the 2015 population sizes as:
- Bronx
1,455,444 - Brooklyn
2,636,735 - Manhattan
1,644,518 - Queens
2,339,150 - Staten Island
474,558
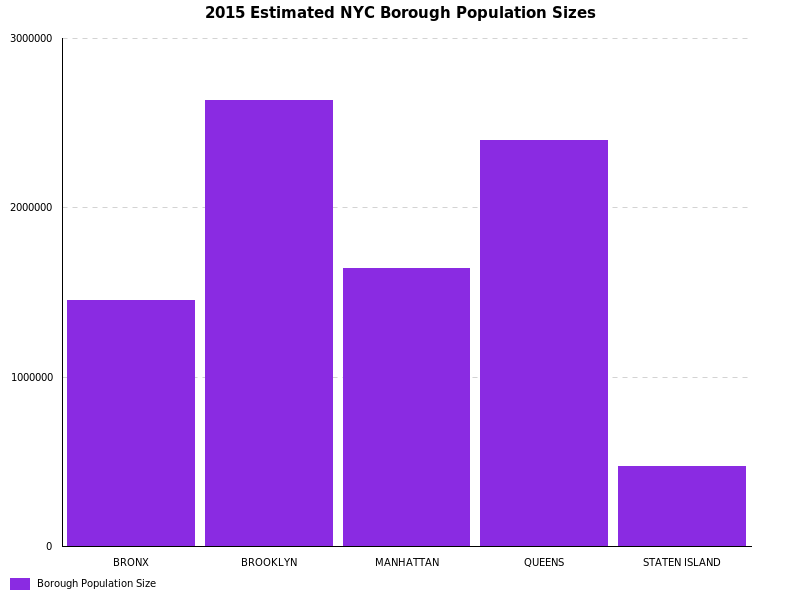
Looking at the bar chart we can see that the population size does not necessarily relate to the complaint count at least for Manhattan. Of course the population sizes are estimated for just 2015 while the complaint count is aggregated over a ~6 year period.
2015
With its interesting spike occurring late in the summer, we zero in on 2015.
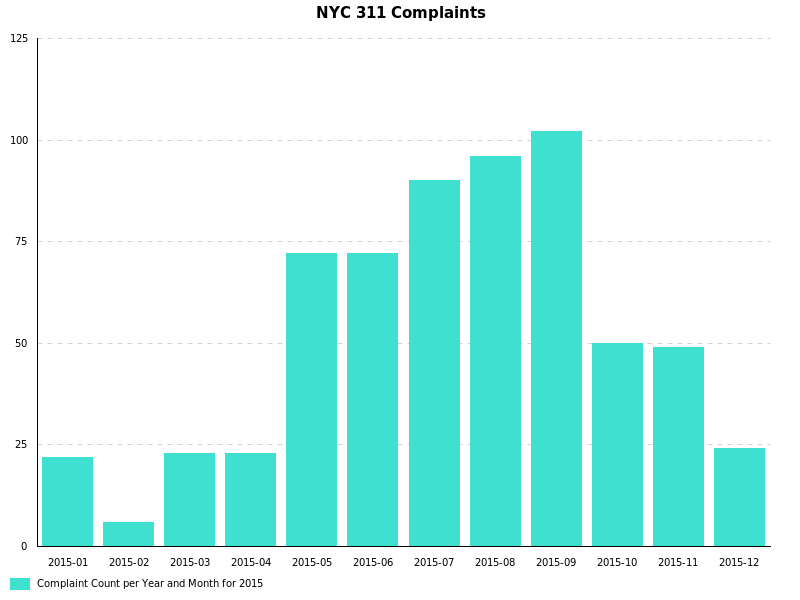
We can see the large spike, that we saw before, occurring in September with just over 100 complaints recorded in a single month.
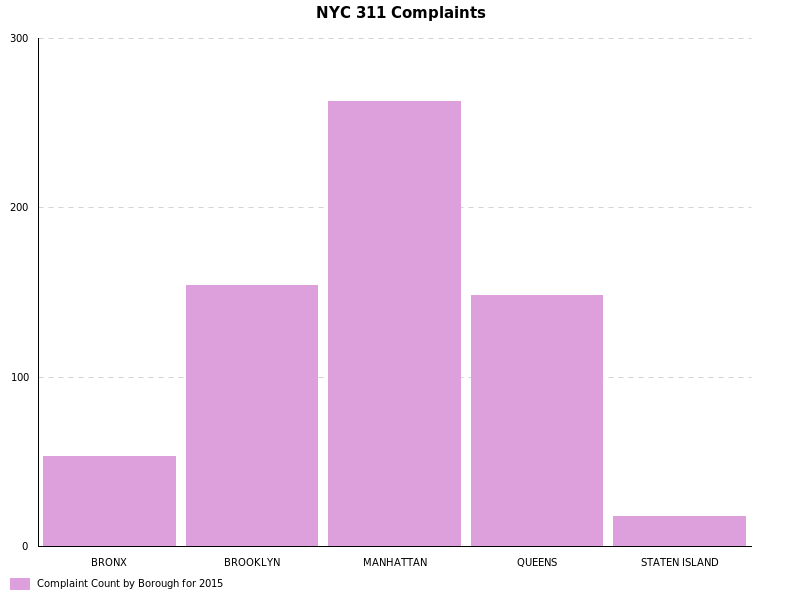
The 2015 borough counts have roughly the same proportion as the borough counts aggregated across the whole six year span.
Comparing the 2015 estimated population sizes against the 2015 complaint borough counts, we see that the relative population and complaint count proportions are not entirely related.
By Day of the Week
The last visualization is the complaint counts per the day of the week.
Box Plot
Haskell Chart does not have an out-of-the-box solution for box plots. However, we can re-purpose its candlestick chart interface. We will use the bucketed by day counts and for each day of the week, we will collect the counts–that fell on that day–in a list. Each day of the week will have its own list of counts–the counts found as we scan through the day buckets (Jan 1 2010, Jan 2 2010, …, May 28 2016, May 29, 2016, etc.) With the counts sorted, for each day of the week, we will calculate the min, lower quartile (25%), median (50%), upper quartile (75%), and the max.
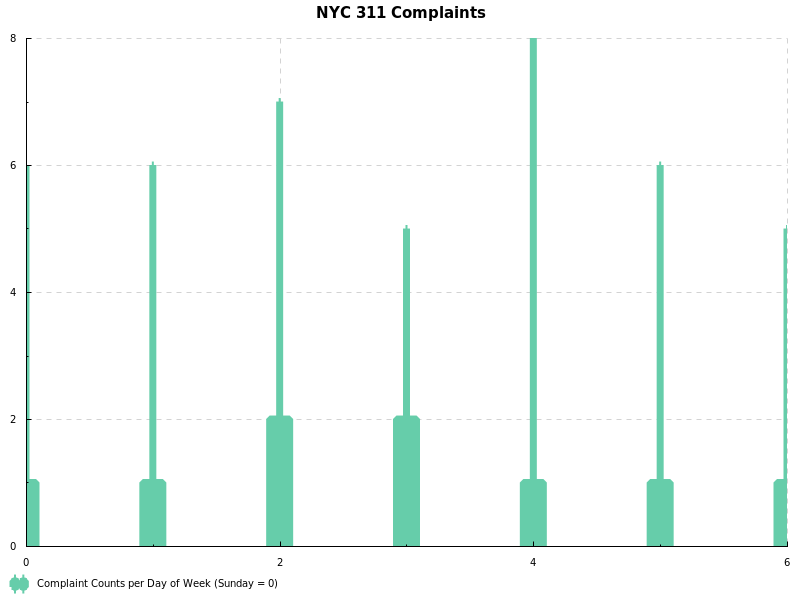
Sunday starts at 0 and the rest of the days of the week follow (Monday at 1, Tuesday at 2, etc.). We see that Tuesday and Wednesday have the largest “middle 50” ranging from zero to two. Thursday has a max of eight–the same eight seen in the September 2015 spike. All have a min of zero.
Recap
Using Haskell, we queried, processed, and visualized 2,678 311 complaints recorded between 2010 and 2016. A definite cyclic pattern can be seen from year to year. Spikes occur in late summer and falloffs occur during fall and winter months. 2015 saw the largest spike in September with just over 100 recorded complaints. 2011 had a large spike in the early part of the year.
Appendix
Below you will find some supplementary material.
Full Source Code
The source is written in Haskell but heavily documents itself.
{-
  David Lettier (C) 2016.
  http://www.lettier.com/
-}

{-# LANGUAGE OverloadedStrings #-}
{-# LANGUAGE DeriveGeneric #-}

module Main where

import GHC.Generics
import System.Directory
import Network.Wreq
import Control.Lens
import Data.Fixed
import Data.Time
import Data.Dates
import Data.Hashable
import Data.Hashable.Time
import qualified Data.List as DL
import qualified Data.HashMap as DHM
import qualified Data.ByteString.Lazy as DBSL
import qualified Data.Sequence as DSeq
import Data.Aeson
import Data.Default.Class
import Data.Colour
import Data.Colour.Names
import Graphics.Rendering.Chart
import Graphics.Rendering.Chart.Backend.Cairo

-------------------------------------------------------------------------------

data ComplaintEntry =
  ComplaintEntry {
      unique_key :: String
    , created_date :: String
    , complaint_type :: String
    , borough :: String
    , location_type :: Maybe String
    , incident_address :: Maybe String
    , incident_zip :: String
  } deriving (Show, Generic)

instance FromJSON ComplaintEntry where
  parseJSON (Object v) =
    ComplaintEntry  <$> v .:  "unique_key"
                    <*> v .:  "created_date"
                    <*> v .:  "complaint_type"
                    <*> v .:  "borough"
                    <*> v .:? "location_type"
                    <*> v .:? "incident_address"
                    <*> v .:  "incident_zip"

instance ToJSON ComplaintEntry

-------------------------------------------------------------------------------

main :: IO ()
main = do
  complaints <- getComplaints
  print $ length complaints
  print $ minCreatedDate complaints
  print $ maxCreatedDate complaints
  renderableToFile def "./charts/complaintCountsPerDayOfWeek.png"  (chartDaysOfWeekComplaintCounts complaints)
  renderableToFile def "./charts/boroughsPopSizes.png"             (chartBoroughsPopSizes complaints)
  renderableToFile def "./charts/yearMonthCounts.png"              (chartComplaintsCountByYearMonth complaints)
  renderableToFile def "./charts/yearMonthCounts2015.png"          (chartComplaintsCountByYearMonth2015 complaints)
  renderableToFile def "./charts/boroughsCounts.png"               (chartComplaintsCountByBoroughs complaints)
  renderableToFile def "./charts/boroughsCounts2015.png"           (chartComplaintsCountByBoroughs2015 complaints)
  renderableToFile def "./charts/createdDatesCounts_month.png"     (chartComplaintsCountByCreatedDatesAtMonth complaints)
  renderableToFile def "./charts/createdDatesCounts_day.png"       (chartComplaintsCountByCreatedDatesAtDay complaints)
  renderableToFile def "./charts/createdDatesCounts_month_day.png" (chartComplaintsCountByCreatedDatesAtMonthDay complaints)
  return ()

-------------------------------------------------------------------------------

complaintEntryMaybeValue :: (ComplaintEntry -> Maybe String) -> ComplaintEntry -> String
complaintEntryMaybeValue f complaint = case f complaint of
                                        Nothing -> ""
                                        Just s  -> s

locationType :: ComplaintEntry -> String
locationType = complaintEntryMaybeValue location_type

incidentAddress :: ComplaintEntry -> String
incidentAddress = complaintEntryMaybeValue incident_address

complaintEntryValuesWFilter :: ([ComplaintEntry] -> [ComplaintEntry]) -> (ComplaintEntry -> String) -> [ComplaintEntry] -> [String]
complaintEntryValuesWFilter _ _ []    = []
complaintEntryValuesWFilter f g (x:y) = map g $ f (x:y)

complaintEntryValues :: (ComplaintEntry -> String) -> [ComplaintEntry] -> [String]
complaintEntryValues = complaintEntryValuesWFilter (filter (\x -> True))

filterCreatedDateYear :: String -> [ComplaintEntry] -> [ComplaintEntry]
filterCreatedDateYear year = filter ((DL.isInfixOf year) . created_date)

filterCreatedDate2015 :: [ComplaintEntry] -> [ComplaintEntry]
filterCreatedDate2015 = filterCreatedDateYear "2015"

boroughs :: [ComplaintEntry] -> [String]
boroughs = complaintEntryValues borough

boroughs2015 :: [ComplaintEntry] -> [String]
boroughs2015 = complaintEntryValuesWFilter filterCreatedDate2015 borough

createdDates :: [ComplaintEntry] -> [String]
createdDates = complaintEntryValues created_date

createdDates2015 :: [ComplaintEntry] -> [String]
createdDates2015 = complaintEntryValuesWFilter filterCreatedDate2015 created_date

yearMonths :: [String] -> [String]
yearMonths = map (take 7)

daysOfWeek :: [String]
daysOfWeek = ["Sunday", "Monday", "Tuesday", "Wednesday", "Thursday", "Friday", "Saturday"]

createdDatesYearMonths :: ([ComplaintEntry] -> [String]) -> [ComplaintEntry] -> [String]
createdDatesYearMonths _ [] = []
createdDatesYearMonths f (x:y)= yearMonths $ f (x:y)

createdDatesYearMonthsAll :: [ComplaintEntry] -> [String]
createdDatesYearMonthsAll = createdDatesYearMonths createdDates

createdDatesYearMonths2015 :: [ComplaintEntry] -> [String]
createdDatesYearMonths2015 = createdDatesYearMonths createdDates2015

-------------------------------------------------------------------------------

minMaxCreatedDate :: ([String] -> String) -> [ComplaintEntry] -> String
minMaxCreatedDate _ [] = ""
minMaxCreatedDate f (x:y) = f $ createdDates (x:y)

minCreatedDate :: [ComplaintEntry] -> String
minCreatedDate []    = ""
minCreatedDate (x:y) = minMaxCreatedDate minimum (x:y)

maxCreatedDate :: [ComplaintEntry] -> String
maxCreatedDate []    = ""
maxCreatedDate (x:y) = minMaxCreatedDate maximum (x:y)

complaintsCountByHashable :: (Hashable k, Ord k) => ([ComplaintEntry] -> [k]) -> [ComplaintEntry] -> [(k, Int)]
complaintsCountByHashable f = DL.sortOn fst . DHM.assocs . hashableCounts . f

complaintsCountByBoroughs :: [ComplaintEntry] -> [(String, Int)]
complaintsCountByBoroughs = complaintsCountByHashable boroughs

complaintsCountByBoroughs2015 :: [ComplaintEntry] -> [(String, Int)]
complaintsCountByBoroughs2015 = complaintsCountByHashable boroughs2015

complaintsCountByYearMonth :: [ComplaintEntry] -> [(String, Int)]
complaintsCountByYearMonth = complaintsCountByHashable createdDatesYearMonthsAll

complaintsCountByYearMonth2015 :: [ComplaintEntry] -> [(String, Int)]
complaintsCountByYearMonth2015 = complaintsCountByHashable createdDatesYearMonths2015

complaintsCountByCreatedDatesAtTrunc :: DTFmtTrunc -> [ComplaintEntry] -> [(LocalTime, Int)]
complaintsCountByCreatedDatesAtTrunc trunc = complaintsCountByHashable createdDates'
  where
    createdDates' :: [ComplaintEntry] -> [LocalTime]
    createdDates' = map (dateTimeStringToLocalTime trunc) . createdDates

complaintsCountByCreatedDatesAtMonth :: [ComplaintEntry] -> [(LocalTime, Int)]
complaintsCountByCreatedDatesAtMonth = complaintsCountByCreatedDatesAtTrunc AtMonth

complaintsCountByCreatedDatesAtDay :: [ComplaintEntry] -> [(LocalTime, Int)]
complaintsCountByCreatedDatesAtDay = complaintsCountByCreatedDatesAtTrunc AtDay

complaintsCountsPerDayOfWeek :: [ComplaintEntry] -> [(String, [Int])]
complaintsCountsPerDayOfWeek (x:y) = daysOfWeekCounts
  where
    complaints = (x:y)
    dayCounts = complaintsCountByCreatedDatesAtDay complaints

    localTimeToDayOfWeek :: LocalTime -> String
    localTimeToDayOfWeek lt = show $ dateWeekDay $ dayToDateTime $ localDay lt

    filterDayOfWeek :: String -> [(LocalTime, Int)] -> [(LocalTime, Int)]
    filterDayOfWeek s = filter (\ x -> localTimeToDayOfWeek (fst x) == s)

    dayOfWeekCount :: String -> [Int]
    dayOfWeekCount s = map snd $ filterDayOfWeek s dayCounts

    daysOfWeekCounts = map (\ x -> (x, dayOfWeekCount x)) daysOfWeek

-------------------------------------------------------------------------------

boroughsPopSizes :: [(String, Int)]
boroughsPopSizes = zip boroughNames popSizes2015
  where
    boroughNames = ["BRONX", "BROOKLYN", "MANHATTAN", "QUEENS", "STATEN ISLAND"]
    --              Bronx    Brookly  Manhatt  Queens   SI
    popSizes2014 = [1438159, 2621793, 1636268, 2321580, 473279]
    popSizes2015 = [1455444, 2636735, 1644518, 2399150, 474588]

-------------------------------------------------------------------------------

threeOneOneLayoutTitle :: String
threeOneOneLayoutTitle = "NYC 311 Complaints"

-------------------------------------------------------------------------------

barChart :: [String] -> String -> [(String, Int)] -> Colour Double -> Renderable ()
barChart titles layoutTitle counts color = toRenderable layout
  where
    x_axis_labels = map fst counts
    y_axis_values = map (\ x -> [snd x]) counts

    barChart =
                  plot_bars_titles  .~ titles
                $ plot_bars_values  .~ addIndexes y_axis_values
                $ plot_bars_style   .~ BarsClustered
                $ plot_bars_spacing .~ BarsFixGap 10 5
                $ plot_bars_item_styles .~ repeat (solidFillStyle $ opaque color, Nothing)
                $ def

    layout =
                layout_title .~ layoutTitle
              $ layout_x_axis . laxis_generate .~ autoIndexAxis x_axis_labels
              $ layout_left_axis_visibility . axis_show_ticks .~ False
              $ layout_plots .~ [plotBars barChart]
              $ def :: Layout PlotIndex Int

-------------------------------------------------------------------------------

chartBoroughsPopSizes :: [ComplaintEntry] -> Renderable ()
chartBoroughsPopSizes complaints = barChart titles layoutTitle counts color
  where
    counts = boroughsPopSizes
    titles = ["Borough Population Size"]
    layoutTitle = "2015 Estimated NYC Borough Population Sizes"
    color  = blueviolet

chartComplaintsCountByBoroughs :: [ComplaintEntry] -> Renderable ()
chartComplaintsCountByBoroughs complaints = barChart titles threeOneOneLayoutTitle counts color
  where
    titles = [
          "Complaint Count by Borough from "
        ++ (take 10 $ minCreatedDate complaints)
        ++ " to "
        ++ (take 10 $ maxCreatedDate complaints)
      ]
    counts = complaintsCountByBoroughs complaints
    color  = plum

chartComplaintsCountByBoroughs2015 :: [ComplaintEntry] -> Renderable ()
chartComplaintsCountByBoroughs2015 complaints = barChart titles threeOneOneLayoutTitle counts color
  where
    titles = ["Complaint Count by Borough for 2015"]
    counts = complaintsCountByBoroughs2015 complaints
    color  = plum

chartComplaintsCountByYearMonth :: [ComplaintEntry] -> Renderable ()
chartComplaintsCountByYearMonth complaints = barChart titles threeOneOneLayoutTitle counts color
  where
    titles = ["Complaint Count per Year and Month"]
    counts = complaintsCountByYearMonth complaints
    color  = turquoise

chartComplaintsCountByYearMonth2015 :: [ComplaintEntry] -> Renderable ()
chartComplaintsCountByYearMonth2015 complaints = barChart titles threeOneOneLayoutTitle counts color
  where
    titles = ["Complaint Count per Year and Month for 2015"]
    counts = complaintsCountByYearMonth2015 complaints
    color  = turquoise

-------------------------------------------------------------------------------

lineChart :: (Ord x0, Ord y0, PlotValue x0, PlotValue y0) => [Plot x0 y0] -> Renderable ()
lineChart linePlots = toRenderable layout
  where
    layout =
              layout_title .~ threeOneOneLayoutTitle
            $ layout_x_axis . laxis_override .~ axisGridHide
            $ layout_plots .~ linePlots
            $ layout_grid_last .~ False
            $ def

linePlotAtMonth :: [ComplaintEntry] -> PlotLines LocalTime Int
linePlotAtMonth complaints =
    plot_lines_style .~ (solidLine 3.0 $ opaque skyblue)
  $ plot_lines_values .~ [complaintsCountByCreatedDatesAtMonth complaints]
  $ plot_lines_title .~ "Complaint Count Over Time (Bucketed by Month)"
  $ def

linePlotAtDay :: [ComplaintEntry] -> PlotLines LocalTime Int
linePlotAtDay complaints =
    plot_lines_style .~ (solidLine 3.0 $ opaque tomato)
  $ plot_lines_values .~ [complaintsCountByCreatedDatesAtDay complaints]
  $ plot_lines_title .~ "Complaint Count Over Time (Bucketed by Day)"
  $ def

chartComplaintsCountByCreatedDatesAtMonth :: [ComplaintEntry] -> Renderable ()
chartComplaintsCountByCreatedDatesAtMonth complaints = lineChart plots
  where
    plots = [toPlot $ linePlotAtMonth complaints]

chartComplaintsCountByCreatedDatesAtDay :: [ComplaintEntry] -> Renderable ()
chartComplaintsCountByCreatedDatesAtDay complaints = lineChart plots
  where
    plots = [toPlot $ linePlotAtDay complaints]

chartComplaintsCountByCreatedDatesAtMonthDay :: [ComplaintEntry] -> Renderable ()
chartComplaintsCountByCreatedDatesAtMonthDay complaints = lineChart plots
  where
    plots = map toPlot [linePlotAtDay complaints, linePlotAtMonth complaints]

-------------------------------------------------------------------------------

chartDaysOfWeekComplaintCounts :: [ComplaintEntry] -> Renderable ()
chartDaysOfWeekComplaintCounts complaints = toRenderable layout
  where
    layout =    layout_title .~ threeOneOneLayoutTitle
              $ layout_plots .~ [toPlot candleChart]
              $ def

    daysOfWeekCounts = complaintsCountsPerDayOfWeek complaints

    makeCandle :: (String, [Int]) -> Candle Int Int
    makeCandle dayOfWeekcounts = Candle xIndex low open med close high
      where
        dayOfWeek   = fst dayOfWeekcounts
        counts      = DL.sort $ snd dayOfWeekcounts
        xIndex      = case DL.elemIndex dayOfWeek daysOfWeek of
                        Nothing -> 0
                        Just i  -> i
        low         = minimum counts

        open        = case median $ take index counts of
                        Nothing -> 0
                        Just m  -> fst m

        medianIndex = case median counts of
                        Nothing -> (0, 0)
                        Just m  -> m
        med         = fst medianIndex
        index       = snd medianIndex

        close       = case median $ drop (index + 1) counts of
                        Nothing -> 0
                        Just m  -> fst m

        high        = maximum counts

    candles = map makeCandle daysOfWeekCounts

    candleChart =   plot_candle_line_style      .~ (    line_width .~ 7
                                                      $ line_color .~ opaque mediumaquamarine
                                                      $ def
                                                   )
                  $ plot_candle_fill            .~ True
                  $ plot_candle_rise_fill_style .~ (fill_color .~ opaque mediumaquamarine $ def)
                  $ plot_candle_tick_length     .~ 1
                  $ plot_candle_width           .~ 10
                  $ plot_candle_values          .~ candles
                  $ plot_candle_title           .~ "Complaint Counts per Day of Week (Sunday = 0)"
                  $ def

-------------------------------------------------------------------------------

complaintsURL :: String
complaintsURL = "https://data.cityofnewyork.us/resource/fhrw-4uyv.json"

complaintsFile :: String
complaintsFile = "./data/complaints.json"

getComplaints :: IO [ComplaintEntry]
getComplaints = do
  fileExists <- doesFileExist complaintsFile
  if fileExists
    then getComplaintsFromFile
    else do
      complaints <- getComplaintsFromURL
      DBSL.writeFile complaintsFile $ encode (DSeq.fromList complaints)
      return complaints

getComplaintsFromFile :: IO [ComplaintEntry]
getComplaintsFromFile = do
  complaintsRaw <- DBSL.readFile complaintsFile
  let complaints =  case decode complaintsRaw :: Maybe [ComplaintEntry] of
                      Nothing -> []
                      Just c  -> c
  return complaints

getComplaintsFromURL :: IO [ComplaintEntry]
getComplaintsFromURL = do
  let opts =  defaults
                & param "$where" .~ ["complaint_type like 'Uri%in Public'"]
                & param "$order" .~ ["created_date DESC"]
                & param "$limit" .~ ["50000"]
  r <- asJSON =<< getWith opts complaintsURL :: IO (Response [ComplaintEntry])
  print $ r ^. responseStatus
  let complaints =  case (r ^? responseBody) of
                      Nothing -> []
                      Just c  -> c
  return complaints

-------------------------------------------------------------------------------

hashableCounts' :: (Hashable k, Ord k) => [k] -> DHM.Map k Int -> DHM.Map k Int
hashableCounts' []    mpIn = mpIn
hashableCounts' (x:y) mpIn = hashableCounts' y mpOut
  where
    value = case DHM.lookup x mpIn of
              Nothing -> 0
              Just v  -> v + 1
    mpOut = DHM.insert x value mpIn

hashableCounts :: (Hashable k, Ord k) => [k] -> DHM.Map k Int
hashableCounts []    = DHM.empty
hashableCounts (x:y) = hashableCounts' (x:y) DHM.empty

data DTFmtTrunc = AtMonth | AtDay | AtSecond deriving (Enum)

dateTimeStringToLocalTime :: DTFmtTrunc -> String -> LocalTime
dateTimeStringToLocalTime trunc s = case trunc of
                                      AtMonth  -> LocalTime fg' midnight
                                      AtDay    -> LocalTime fg  midnight
                                      AtSecond -> LocalTime fg  tod
  where
        --  1234567890123456789
        -- "2016-04-18T19:42:20.000"
        year   = read (take 4 s) :: Integer
        month  = read (take 2 $ drop 5 s) :: Int
        day    = read (take 2 $ drop 8 s) :: Int
        hour   = read (take 2 $ drop 11 s) :: Int
        minute = read (take 2 $ drop 14 s) :: Int
        second = read (take 2 $ drop 17 s) :: Pico
        fg  = fromGregorian year month day
        fg' = fromGregorian year month 01
        tod = TimeOfDay hour minute second

median :: (Ord a) => [a] -> Maybe (a, Int)
median []    =  Nothing
median (x:y) = quickSelect midEven (x:y) >>= (\x -> Just (x, midEven))
  where
    midEven = length (x:y) `div` 2

quickSelect :: (Ord a) => Int -> [a] -> Maybe a
quickSelect _ []        = Nothing
quickSelect n _
  | n < 0               = Nothing
quickSelect n (pivot:y) = case found of
                            True  ->  Just pivot
                            False ->  case goHigher of
                                        True  -> quickSelect (n - (length (pivot:lower))) higher
                                        False -> quickSelect n lower
  where
    lower       = filter (<= pivot) y
    higher      = filter (> pivot) y
    partitioned = lower ++ (pivot:higher)
    found       = partitioned !! n == pivot
    pivotIndex  = case DL.elemIndex pivot partitioned of
                    Nothing -> error "Pivot not found."
                    Just a  -> a
    goHigher    = n > pivotIndex