The Code and final build
You can try out the final build of the simple linear regression calculator at lettier.com/simple-linear-regression. All of the code for the project is hosted on GitHub.
Who this is for
- Haskell programmers looking to solve The JavaScript Problem
- Programmers interested in functional programming
- JavaScript programmers looking to try out PureScript
- Web developers searching for a new approach
- Data scientists brushing up on the basics
- Machine learning engineers curious about the algorithms they use
What we’ll cover
- Using Yarn and NPM scripts
- Building Sass
- Setting up PureScript
- Linear Regression
- Gradient Descent
- Machine Learning Parameters
- PRESS Statistic
- Functional Programming
- Using the Halogen library to build our UI
Project setup
Before we begin developing, we need to set up our project with all of its files and dependencies.
File structure
simple-linear-regression/
  dist/
    app.js
    index.css
    index.html
  src/
    LinearRegression.purs
    Main.purs
    Matrix.purs
    Plot.js
    Plot.purs
    UI.purs
    Utils.purs
  static/
    html/
      index.html
    scss/
      index.scss
  .nvmrc
  bower.json
  package.json
This will be layout for our project.
The .purs extension is short for PureScript. If you have ever used Haskell, the syntax is very similar. Here is a quick guide to get a feel for the language.
PureScript is a small strongly typed programming language that compiles to JavaScript.
Go ahead and run the following commands.
mkdir -p simple-linear-regression
cd simple-linear-regression
mkdir -p dist src static static/html static/scss
touch .nvmrc bower.json package.json
cd src
touch LinearRegression.purs Main.purs Matrix.purs Plot.js Plot.purs UI.purs Utils.purs
cd ..
cd static
touch html/index.html scss/index.scss
cd ..
NVM
We will need to install Node.js using NVM. NVM allows us to easily switch between different versions of Node.
cd ~/Downloads
wget -qO- https://raw.githubusercontent.com/creationix/nvm/v0.33.1/install.sh | bash
cd ~/simple-linear-regression
echo 'v5.5.0' > .nvmrc
nvm use
Yarn
To speed up the downloading and installation of our dependencies, will we use Yarn.
cd ~/Downloads
curl -o- -L https://yarnpkg.com/install.sh | bash
NPM
Open up your favorite text editor and copy this into the package.json file.
{
    "name": "simple-linear-regression"
  , "description": "Simple linear regression calculator."
  , "homepage": "http://lettier.com/simple-linear-regression/"
  , "license": "Apache-2.0"
  , "author": "David Lettier"
  , "private": true
  , "scripts": {
      "installPackages": "yarn && bower install"
    , "buildSrc": "pulp build"
    , "buildDist": "mkdir -p dist && pulp browserify --to dist/app.js && node-sass static/scss/index.scss dist/index.css && cp -R static/images/. dist/ && cp -R static/html/. dist/"
    , "watchBuildDist": "onchange './static/**/*' './src/**/*' -i -- yarn buildDist"
  }
  , "dependencies": {
      "virtual-dom": "^2.1.1"
    , "chartjs-color": "^2.0.0"
    , "moment": "^2.10.6"
  },
  "devDependencies": {
      "pulp": "^10.0.0"
    , "purescript": "^0.10.2"
    , "node-sass": "4.3.0"
    , "onchange": "^3.2.1"
  }
}
With this file we have four NPM scripts we can run with Yarn. watchBuildDist will be really convenient when we start developing as it will build the project into dist/ each time we make a change to any of the project files. Once the project is built, we can just refresh our browser.
Bower
Open up your favorite editor and copy this into the bower.json file.
{
    "name": "simple-linear-regression"
  , "description": "Simple linear regression calculator."
  , "homepage": "http://lettier.com/simple-linear-regression/"
  , "license": "Apache-2.0"
  , "authors": ["David Lettier"]
  , "private": true
  , "ignore": [
      "**/.*"
    , "node_modules"
    , "bower_components"
    , "output"
  ]
  , "dependencies": {
      "chart.js": "2.4.0"
    , "purescript-prelude": "^2.1.0"
    , "purescript-console": "^2.0.0"
    , "purescript-foldable-traversable": "2.0.0"
    , "purescript-arrays": "3.1.0"
    , "purescript-math": "2.0.0"
    , "purescript-integers": "2.1.0"
    , "purescript-maybe": "2.0.1"
    , "purescript-globals": "2.0.0"
    , "purescript-halogen": "*"
  }
  , "devDependencies": {
      "purescript-psci-support": "^2.0.0"
  }
}
We can now go ahead and install all of our dependencies so make sure to run the following commands.
cd simple-linear-regression
yarn run installPackages
Linear Regression
(inputs[0][0],   inputs[0][1], ..., inputs[0][N-1], outputs[0])
(inputs[1][0],   inputs[1][1], ..., inputs[1][N-1], outputs[1])
...
(inputs[N-1][0], inputs[0][1], ..., inputs[0][N-1], outputs[N-1])
In simple terms, linear regression is the process of being given some inputs, their corresponding outputs, and finding a linear function out there in the universe that, when given the inputs we were given, hopefully produces outputs the same as or very close to the outputs we were given. If we performed our search correctly, no other linear function comes as close to the one we found. In other words, our goal is to find the best/optimal linear function that describes the relationship between the input and the output.
If a linear function produced the data we were given, our search will be fruitful. The function we find will model the relationship, between the input and output, extremely well—maybe even perfectly. However if some other non-linear process produced the data, our linear-function will be—in some cases—far from the truth.
For example, say we are given the following data.
inputs[0]: 2.8,               outputs[0]:  0.3349881501559051
inputs[1]: 2.9,               outputs[1]:  0.23924932921398243
inputs[2]: 3.0,               outputs[2]:  0.1411200080598672
inputs[3]: 3.1,               outputs[3]:  0.04158066243329049
inputs[4]: 3.141592653589793, outputs[4]:  0.0
inputs[5]: 3.2,               outputs[5]: -0.058374143427580086
inputs[6]: 3.3,               outputs[6]: -0.1577456941432482
inputs[7]: 3.4,               outputs[7]: -0.2555411020268312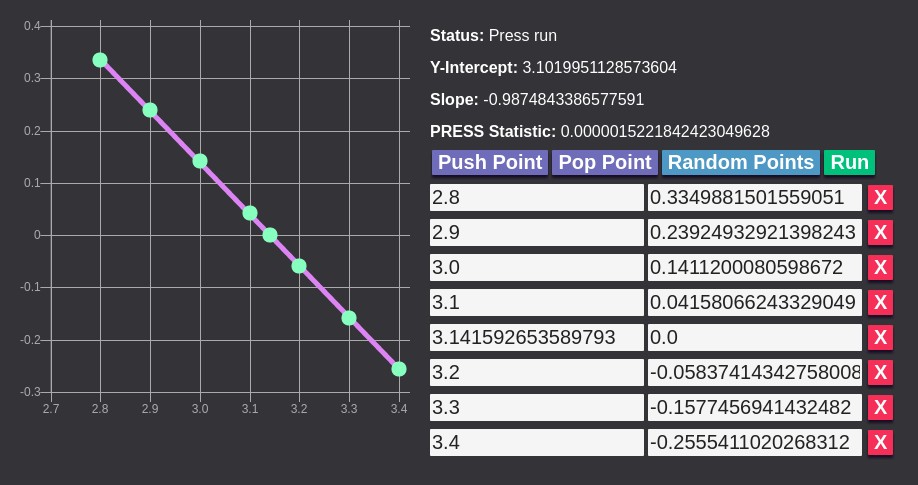
We search the universe and arrive at the function y = -x + PI. This models the relationship quite well for the points given. In the range [2.8, 3.4], we can confidently use our model to produce outputs that we were not given. However after seeing the actual function that produced the data, y = sin(x), we realize how far off our model is.
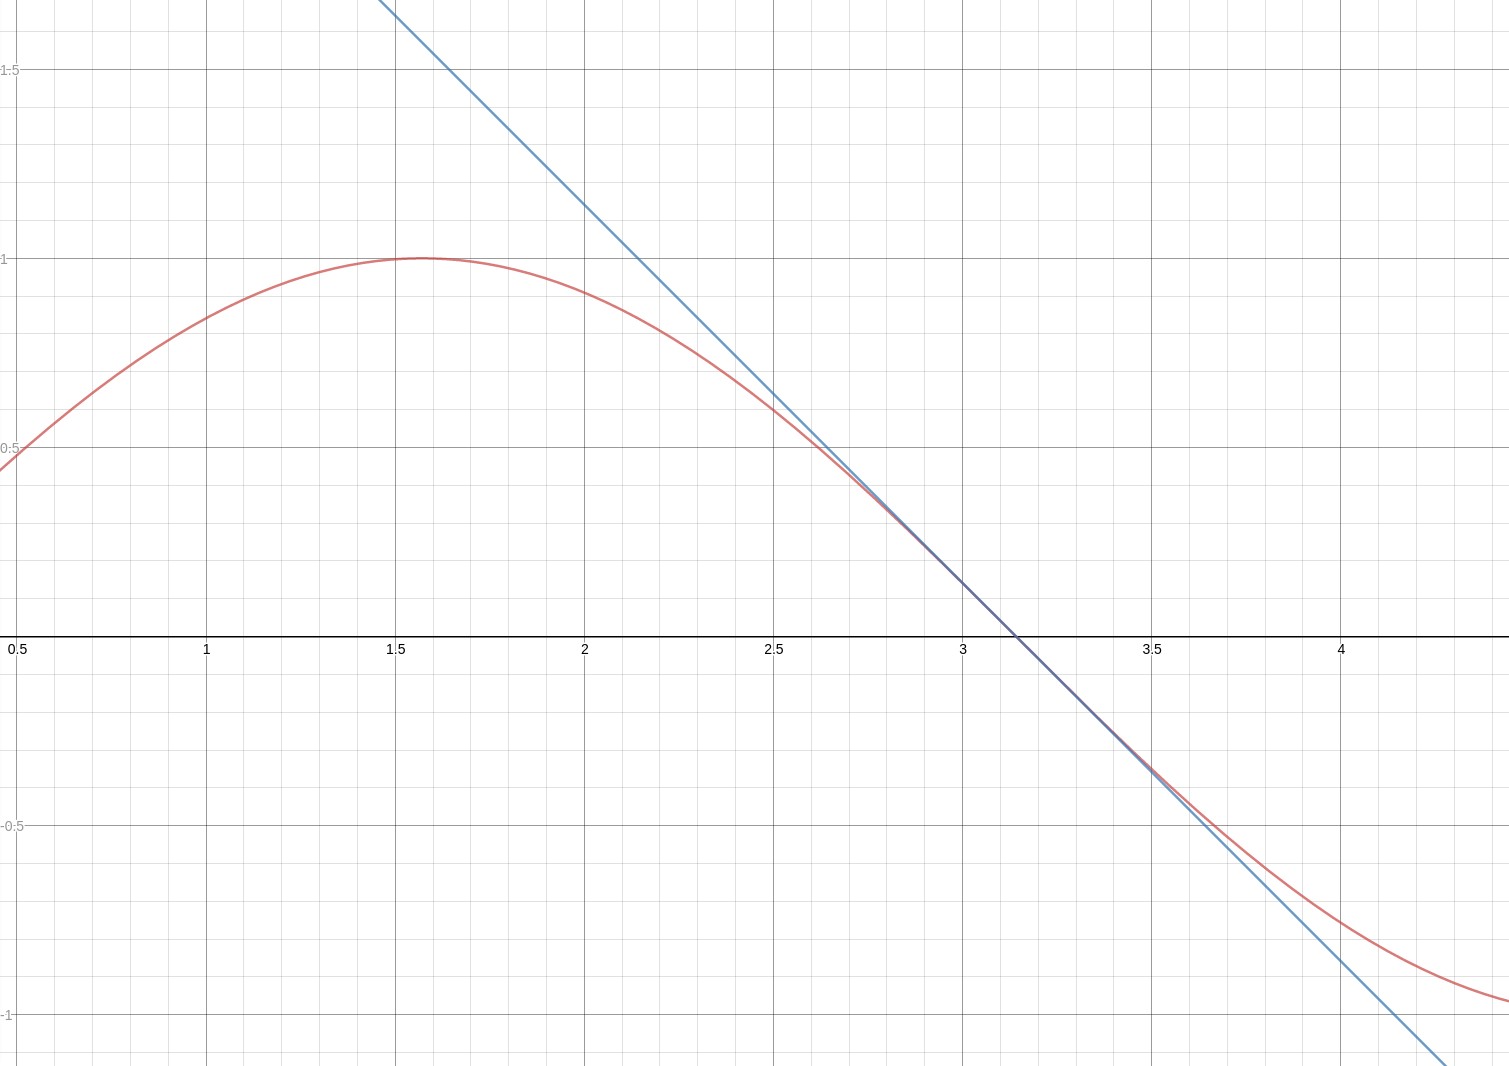
Our linear function versus the actual function.
You can see that for an input such as 1.5, our function or model of reality 1.6416 = -1.5 + PI is far from the truth 0.975 = sin(1.5).
Extrapolation is making a prediction outside the range of values of the predictor in the sample used to generate the model. The more removed the prediction is from the range of values used to fit the model, the riskier the prediction becomes because there is no way to check that the relationship continues to be linear.
This search for the right function is known as “fitting a model”, where we try to make our model fit the data or observations given. In some respects, it is like searching through stacks of pants to find the perfect fit or interviewing hundreds of candidates for the right culture fit.
Hypothesis Function
So what does the best linear function look like? Fortunately we a have a straight forward “template” which grows with the size of the input or “explanatory variables”—they help explain the output.
predictions[i] = coefficients[0]   * 1              +
                 coefficients[1]   * inputs[i][0]   +
                 ...                                +
                 coefficients[N-1] * inputs[i][N-1]

               = coefficients[0] * 1 + sum[0...j...(N-1)](coefficients[j + 1] * inputs[i][j])

               = hypothesis[i]
This is known as the “hypothesis” function.
The inputs[i][j] we know from the data but we don’t know the coefficients[i]. This is what we are specifically searching for—the coefficients that minimize the difference between outputs[i] and predictions[i] for every output given. Ideally for all the outputs[i], the difference predictions[i] - outputs[i] is always zero.
If your data points are just pairs of x and y, the hypothesis function resembles a very familiar equation.
hypothesis[i] = coefficients[0] * 1 + coefficients[1] * inputs[i]

               = y-intercept     * 1 + slope           * x[i]

               = b                   + m               * x[i]
Here the coefficients we need to find are the y-intercept (b) and the slope (m). You’ll notice that this is the point-slope equation of a line.
Simple versus Multiple
For our interactive calculator, we will be performing simple linear regression where we attempt to model the relationship between one input variable and one output variable. This is opposed to multiple linear regression that models the relationship between two or more input variables (explanatory) and one output variable (the “response”). For example, if your data looks like (x, y, z), you would use multiple instead of simple linear regression.
While our calculator will only be performing simple, our LinearRegression.purs library/module will be capable of performing multiple.
Cost Function
calculateCost :: Vector -> Matrix -> Vector -> Number
calculateCost _            _            []          = 0.0
calculateCost coefficients designMatrix regressands = sum errors / size
  where
    size = lengthNum regressands
    regressands' = map (hypothesis coefficients) designMatrix
    errors = map (\ (Tuple y' y) -> pow (y' - y) 2.0) (zip regressands' regressands)
Earlier we said that our goal was to find the collection of coefficients that minimize the difference between the outputs given and the predicted outputs (as given by our hypothesis function). More precisely we wish to minimize our cost or loss function.
The cost function takes the coefficients we’ve come up with, the rows of inputs given, the list of outputs given, and returns the mean squared error or MSE.
To calculate the MSE, the cost function calculates the squared error (difference) between each given and predicted output, sums these squared errors (predicted output - given output)^2, and then divides the sum by the size of the given outputs.
If our hypothesis function is perfect, we will have a MSE of zero.
An MSE of zero, meaning that the estimator predicts observations of the parameter θ with perfect accuracy, is the ideal, but is typically not possible.
Minimizing the cost function is the act of finding the smallest MSE possible. For some problems, a MSE of zero may not be possible.
Notice that we cannot change the inputs (designMatrix) or outputs (regressands) as those were given to us. The only values we can change are the coefficients. As we change the coefficients, the MSE will either increase, decrease, or stay the same. Ideally we want to keep changing the coefficients such that the MSE continuously decreases until it reaches zero.
Once the MSE never drops below a certain number or it reaches zero, we have reached the end of our search and our model has been fitted.
Gradient Descent
So far we have seen that linear regression is essentially a search problem. Our goal is to find the optimal collection of coefficients that reduce our cost function the most. But how do we find the best coefficients?
- We could continuously guess, calculate the cost, and if it is less than the last cost, update the coefficients
- We could find a closed-form solution such that no matter the data, we could always find the most optimal coefficients analytically using only a finite number of operations
- We could find the gradient of the cost function, start with an initial guess, and then continuously evaluate and move in the opposite direction of the gradient until we have reached some cutoff point or when the gradient is zero
For the calculator we will use the last option which is known as gradient descent.
Gradient Function

Descending down the cost function.
Recall that our cost function takes in the coefficients we currently have and returns the mean squared error. This tells us how wrong we are and—in the case of it being zero—when we no longer need to search. But if we must keep searching, it doesn’t tell us where we should search next. This is where the gradient function comes in.
The gradient of our cost function will act like a guide. For every position that we search, the gradient function will output a vector. This vector tells us in what direction, from where we currently are, is the cost function increasing the most and what the slope/steepness/grade of that direction is. Note that to minimize the cost function, we have go in the opposite direction of the gradient.
If we ever reach a minima, maxima, or saddle point, the gradient will not have a direction and its magnitude (or slope of the graph at that point) will be zero. For this case we can either stop our search and accept our current position or we can start our search over with a new guess.
hypothesis[i] = coefficients[0] * 1 + sum[0...j...(N-1)](coefficients[j + 1] * inputs[i][j])

cost = (1 / (2 * N)) * sum[0...i...(N-1)]((hypothesis[i] - outputs[i])^2)

partialDerivative[0]     = (1 / N) * sum[0...j...(N-1)]((hypothesis[j] - outputs[j]) * 1           )
partialDerivative[i > 0] = (1 / N) * sum[0...j...(N-1)]((hypothesis[j] - outputs[j]) * inputs[j][i])

gradient = <partialDerivative[0], partialDerivative[1], ..., partialDerivative[N-1]>
Each element i in the gradient (vector) is the partial derivative of the cost function with respect to coefficient i.
partialDerivative[0] = (1 / N) * sum[0...j...(N-1)]((hypothesis[j] - outputs[j]) * 1 )Remember that we always have one more coefficient than we do the number of elements in a feature vector (the number of columns in our design matrix or inputs). The zero coefficient is always times one and the derivative of coefficient[0] * 1 with respect to coefficient[0] is just 1—hence the subtle difference for the partialDerivative of coefficient zero.
cost = (1 / (2 * N)) * sum[0...i...(N-1)]((hypothesis[i] - outputs[i])^2)Note that we alter our cost function a bit and add a 2 in (1 / (2 * N)). This makes for a cleaner partial derivative and will not disrupt our search as the coefficients that minimize the cost function with the added two will also minimize the cost function without the added two.
partialDerivative :: Int -> Vector -> Matrix -> Vector -> Number
partialDerivative _ []           _            _           = 0.0
partialDerivative _ _            []           _           = 0.0
partialDerivative _ _            _            []          = 0.0
partialDerivative i coefficients designMatrix regressands = if i < 0 then 0.0 else result
  where
    size = lengthNum regressands
    tuples = zip regressands designMatrix
    result = (1.0 / size) * (sum (map mapper tuples))
    mapper :: Tuple Number Vector -> Number
    mapper (Tuple _ []) = 0.0
    mapper (Tuple y regressors) = ((hypothesis coefficients regressors) - y) * xj
      where
        xj = if i == 0 then 1.0 else (fromMaybe 0.0 (regressors !! (i - 1)))
The first line is the type signature while the next three are pattern matching for empty input.
    result = (1.0 / size) * (sum (map mapper tuples))
    mapper (Tuple y regressors) = ((hypothesis coefficients regressors) - y) * xj
In these two lines we calculate the partialDerivative with respect to coefficient i. If we are calculating the partialDerivative for coefficient 0 then xj is one.
    paritalDerivativeMapper i = partialDerivative i coefficients designMatrix regressands
    gradient = map paritalDerivativeMapper (range 0 (length coefficients - 1))
Putting it all together, we compute and return the gradient vector.
Learning Rate
The cost function tells us if we should keep searching. The gradient tells us where we should search next. We now visit the learning rate which controls how far into the opposite direction of the gradient we advance.
In terms of the gradient descent algorithm, the learning rate is a throttle we use to control how “fast” we move around our cost function as we search for the global minimum. Setting it too high will cause the search to bounce around, possibly overshooting our target. Setting it too low will bring your search to a crawl, taking hours to converge (the coefficients no longer update).
One strategy is to set the learning rate in the beginning and then keep it constant while running gradient descent. Another strategy is to continuously update it as the search progresses. We will take the latter approach and use a technique called bold driver.
    learningRate' =
      if previousCalculatedCost < currentCalculatedCost
        then learningRate - (learningRate * 0.5)
        else learningRate + (learningRate * 0.5)
Here you see our use of bold driver. If the previous cost is less than the current cost, we throttle down. Otherwise, we throttle up.
Coefficient Update
The final part of gradient descent is the actual updating of the coefficients.
updateCoefficients :: Number -> Vector -> Matrix -> Vector -> Vector
updateCoefficients learningRate coefficients designMatrix regressands = result
  where
    paritalDerivativeMapper i = partialDerivative i coefficients designMatrix regressands
    gradient = map paritalDerivativeMapper (range 0 (length coefficients - 1))
    result = map (\ (Tuple o g) -> o - (learningRate * g)) (zip coefficients gradient)
Using the learning rate and the gradient, we map over the coefficients and return them updated. The update function is the following.
newCoefficient[i] = oldCoefficient[i] - (learningRate * partialDerivative[i])PRESS Statistic
As with any machine learning endeavor, you’ll want to cross-validate the model you have built. Cross-validation can help detect overfitting which is typically present when your model performs well for observations it trained on but performs poorly on observations it did not train on. For our calculator we will use the PRESS statistic method.
In statistics, the predicted residual error sum of squares (PRESS) statistic is a form of cross-validation used in regression analysis to provide a summary measure of the fit of a model to a sample of observations that were not themselves used to estimate the model. It is calculated as the sums of squares of the prediction residuals for those observations.
One simple way to calculate the PRESS statistic is the leave-one-out strategy.
- For every input-output pair
i- Perform linear regression on all pairs except
i - Using the found coefficients, calculate the squared error
(hypothesis[i] - outputs[i])^2
- Perform linear regression on all pairs except
- Sum all of the squared errors to obtain the PRESS statistic
Unfortunately this requires performing linear regression as many times as the number of observations you have. We will take another approach and use the projection or hat matrix (it maps the given outputs to the predicted outputs).
The hat matrix enters this discussion because it saves a lot of calculation. One need not actually re-calculate the regression results N different times. Rather, it is true that the PRESS residual is equal to the ordinary residual divided by 1 minus the diagonal of the hat matrix.
X = designMatrix or rows of given inputs

hatMatrix = X * (transpose(X) * X)^-1 * transpose(X)
We can perform the needed matrix math using the library from Let’s make a Matrix Inverse Calculator with PureScript.
pressStatistic = sum[0...i...(N-1)](((hypothesis[i] - output[i]) / (1 - hatMatrix[i][i]))^2)Our revised method for computing the PRESS statistic is the following.
- For every input-output pair
i- Calculate
errors[i] = (hypothesis[i] - outputs[i]) / (1 - hatMatrix[i][i]) - Square each
errors[i]
- Calculate
- Sum the list of squared
errors[i].
We can now translate this outline into actual code.
    predictions :: Vector
    predictions = map (\ regressors -> hypothesis coefficients regressors) designMatrix
First we calculate the predictions using the fitted or learned coefficients after having performed linear regression using all of the input-output pairs.
    residuals :: Vector
    residuals = map (\ (Tuple y y') -> y - y') (zip regressands predictions)
Next we calculate all of the residuals or errors between predicted and given.
    hatMatrix :: Matrix
    hatMatrix = fromMaybe [] (calculateHatMatrix designMatrix)
Using the equation from up above, we obtain the hat matrix.
calculatePressStatistic :: Vector -> Vector -> Matrix -> Maybe Number
calculatePressStatistic []          _            _            = Nothing
calculatePressStatistic _           []           _            = Nothing
calculatePressStatistic _           _            []           = Nothing
calculatePressStatistic regressands coefficients designMatrix = maybeSummation
  where
    -- ...
    folder :: Maybe Number -> Int -> Maybe Number
    folder Nothing  _ = Nothing
    folder (Just acc) i =
      if
        isNothing maybeResidual ||
        isNothing maybeTerm ||
        1.0 - term == 0.0
          then Nothing
          else Just (acc + (pow (residual / (1.0 - term)) 2.0))
      where
        maybeResidual :: Maybe Number
        maybeResidual = residuals !! i
        residual :: Number
        residual = fromMaybe 0.0 maybeResidual
        row :: Vector
        row = fromMaybe [] (hatMatrix !! i)
        maybeTerm :: Maybe Number
        maybeTerm = row !! i
        term :: Number
        term = fromMaybe 0.0 maybeTerm
    maybeSummation :: Maybe Number
    maybeSummation = foldl folder (Just 0.0) (range 0 (length regressands - 1))
Here we put it all together and return maybeSummation which may be Nothing or Just the PRESS statistic.
LinearRegression.purs
Go ahead now and open up the src/LinearRegression.purs file with your favorite text editor
module LinearRegression (
      runLinearRegressionWithUnscaled
    , calculatePressStatistic
  ) where
At the top of the file we define our LinearRegression module and export two functions for other modules to use.
import Prelude

import Math (pow)

import Data.Ord (abs)
import Data.Maybe (Maybe(..), fromMaybe, isNothing)
import Data.Either (Either(..))
import Data.Foldable (sum, foldl)
import Data.Array (zip, (!!), range, length)
import Data.Tuple (Tuple(..))

import Utils (lengthNum, containsNothing)

import Matrix (Vector, Matrix, transpose, multiplyMatrices, invertMatrix)
Next we list the various module dependencies (and their functions) we will need to perform our linear regression calculations. Utils and Matrix are custom modules that we will have to write ourselves.
runLinearRegressionWithUnscaled :: Int -> Number -> Number -> Vector -> Vector -> Matrix -> Vector
runLinearRegressionWithUnscaled
  maxIterations
  maxCost
  learningRate
  coefficients
  regressands
  unscaledDesignMatrix
  = if containsNothing unscaledUpdatedCoefficents then [] else map (fromMaybe 0.0) unscaledUpdatedCoefficents
The major function in the module is runLinearRegressionWithUnscaled. The UI module will need to call this function with the data points in order to receive the found coefficients.
  maxIterations
  maxCost
  learningRate
  coefficients
  regressands
  unscaledDesignMatrix
These are the inputs to runLinearRegressionWithUnscaled.
maxIterationsis anIntmaxCostis aNumberlearningRateis aNumbercoefficientsis an array of numbers orVectorregressands(the outputs found in the data) is aVectorunscaledDesignMatrix(the inputs found in the data) is an array of arrays of numbers orMatrix
You can see how that lines up with the following type signature.
runLinearRegressionWithUnscaled :: Int -> Number -> Number -> Vector -> Vector -> Matrix -> VectorThe final Vector on the end will be the found coefficients.
So if our data was the following.
| Regressors  | Regressands |
|=============|=============|
| x: 1, y: 2, | z: 3        |
| x: 4, y: 5, | z: 6        |
| x: 7, y: 8, | z: 9        |
Then our function call would look like this.
runLinearRegressionWithUnscaled        -- function
  1000                                 -- maxIterations (configuration)
  0.0001                               -- maxCost (configuration)
  0.5                                  -- learningRate (initial guess)
  [1.0, 1.0, 1.0]                      -- coefficients (initial guess)
  [3.0, 6.0, 9.0]                      -- regressands (the Zs)
  [[1.0, 2.0], [4.0, 5.0], [7.0, 8.0]] -- unscaledDesignMatrix (the Xs and Ys)
After making this function call, the output will be the best coefficients found.
hypothesis :: Vector -> Vector -> Number
hypothesis coefficients regressors = sum $ map (\ (Tuple c r) -> c * r) tuples
  where
    tuples = zip coefficients ([1.0] <> regressors)
Given the found coefficients and a row of input data (regressors), the hypothesis function outputs a prediction.
[
    { x: 1, y: 1 }
  , { x: 2, y: 2 }
  , { x: 3, y: 3 }
  , { x: 4, y: 4 }
  , { x: 5, y: 5 }
  , { x: 6, y: 6 }
]
Say our data looked like the x and y pairs up above.
[0.0, 1.0]And our coefficients were zero and one.
hypothesis [0.0, 1.0] [7.0] = 7.0Then the hypothesis would output 7.0.
tuples = zip coefficients ([1.0] <> regressors)Notice that we add a 1.0 to the beginning of the regressors list.
hypothesis [0.0, 1.0] [7.0] = coefficient[0] * regressor[0] + coefficient[1] * regressor[1]
                            = 0.0            * 1.0          + 1.0            * 7.0
                            = 7.0
This makes the computation convenient as the first coefficient doesn’t have a corresponding input/regressor/explanatory variable.
calculatePressStatistic :: Vector -> Vector -> Matrix -> Maybe Number
calculatePressStatistic []          _            _            = Nothing
calculatePressStatistic _           []           _            = Nothing
calculatePressStatistic _           _            []           = Nothing
calculatePressStatistic regressands coefficients designMatrix = maybeSummation
  where
    -- ...
The other major function in the module is calculatePressStatistic. The UI will use this as well to display the PRESS statistic to the user after every runLinearRegressionWithUnscaled.
Below is the entire src/LinearRegression.purs file. Make sure to copy it over.
{-
  (C) 2017 David Lettier
  lettier.com
-}

module LinearRegression (
      runLinearRegressionWithUnscaled
    , calculatePressStatistic
  ) where

import Prelude

import Math (pow)

import Data.Ord (abs)
import Data.Maybe (Maybe(..), fromMaybe, isNothing)
import Data.Either (Either(..))
import Data.Foldable (sum, foldl)
import Data.Array (zip, (!!), range, length)
import Data.Tuple (Tuple(..))

import Utils (lengthNum, containsNothing)

import Matrix (Vector, Matrix, transpose, multiplyMatrices, invertMatrix)

runLinearRegressionWithUnscaled :: Int -> Number -> Number -> Vector -> Vector -> Matrix -> Vector
runLinearRegressionWithUnscaled
  maxIterations
  maxCost
  learningRate
  coefficients
  regressands
  unscaledDesignMatrix
  = if containsNothing unscaledUpdatedCoefficents then [] else map (fromMaybe 0.0) unscaledUpdatedCoefficents
  where
    transposedUnscaledDesignMatrix = transpose unscaledDesignMatrix
    maybeMeans = map mean transposedUnscaledDesignMatrix
    maybeStandardDeviations = map (\ (Tuple m v) ->
        standardDeviation m v
      ) (zip maybeMeans transposedUnscaledDesignMatrix)
    scaledTransposedDesignMatrix = scaleTransposedDesignMatrix maybeMeans maybeStandardDeviations transposedUnscaledDesignMatrix
    scaledDesignMatrix = transpose scaledTransposedDesignMatrix
    scaledUpdatedCoefficents =
      runLinearRegressionWithScaled
        0
        maxIterations
        maxCost
        learningRate
        coefficients
        regressands
        scaledDesignMatrix
    unscaledUpdatedCoefficents = unscaleCoefficients maybeMeans maybeStandardDeviations scaledUpdatedCoefficents

runLinearRegressionWithScaled :: Int -> Int -> Number -> Number -> Vector -> Vector -> Matrix -> Vector
runLinearRegressionWithScaled
  currentIteration
  maxIterations
  maxCost
  learningRate
  coefficients
  regressands
  scaledDesignMatrix
  =
    if
      currentCalculatedCost <= maxCost ||
      currentIteration >= maxIterations ||
      abs (currentCalculatedCost - previousCalculatedCost) == 0.0
      then coefficients'
      else
        runLinearRegressionWithScaled
          (currentIteration + 1)
          maxIterations
          maxCost
          learningRate'
          coefficients'
          regressands
          scaledDesignMatrix
  where
    updatedCoefficients = updateCoefficients learningRate coefficients scaledDesignMatrix regressands
    previousCalculatedCost = calculateCost coefficients        scaledDesignMatrix regressands
    currentCalculatedCost  = calculateCost updatedCoefficients scaledDesignMatrix regressands
    -- Bold Driver - http://www.willamette.edu/~gorr/classes/cs449/momrate.html
    coefficients' = if previousCalculatedCost < currentCalculatedCost then coefficients else updatedCoefficients
    learningRate' =
      if previousCalculatedCost < currentCalculatedCost
        then learningRate - (learningRate * 0.5)
        else learningRate + (learningRate * 0.5)

hypothesis :: Vector -> Vector -> Number
hypothesis coefficients regressors = sum $ map (\ (Tuple c r) -> c * r) tuples
  where
    tuples = zip coefficients ([1.0] <> regressors)

calculateCost :: Vector -> Matrix -> Vector -> Number
calculateCost _            _            []          = 0.0
calculateCost coefficients designMatrix regressands = sum errors / size
  where
    size = lengthNum regressands
    regressands' = map (hypothesis coefficients) designMatrix
    errors = map (\ (Tuple y' y) -> pow (y' - y) 2.0) (zip regressands' regressands)

partialDerivative :: Int -> Vector -> Matrix -> Vector -> Number
partialDerivative _ []           _            _           = 0.0
partialDerivative _ _            []           _           = 0.0
partialDerivative _ _            _            []          = 0.0
partialDerivative i coefficients designMatrix regressands = if i < 0 then 0.0 else result
  where
    size = lengthNum regressands
    tuples = zip regressands designMatrix
    result = (1.0 / size) * (sum (map mapper tuples))
    mapper :: Tuple Number Vector -> Number
    mapper (Tuple _ []) = 0.0
    mapper (Tuple y regressors) = ((hypothesis coefficients regressors) - y) * xj
      where
        xj = if i == 0 then 1.0 else (fromMaybe 0.0 (regressors !! (i - 1)))

updateCoefficients :: Number -> Vector -> Matrix -> Vector -> Vector
updateCoefficients learningRate coefficients designMatrix regressands = result
  where
    paritalDerivativeMapper i = partialDerivative i coefficients designMatrix regressands
    gradient = map paritalDerivativeMapper (range 0 (length coefficients - 1))
    result = map (\ (Tuple o g) -> o - (learningRate * g)) (zip coefficients gradient)

scaleTransposedDesignMatrix :: Array (Maybe Number) -> Array (Maybe Number) -> Matrix -> Matrix
scaleTransposedDesignMatrix []         _                       _                      = []
scaleTransposedDesignMatrix _          []                      _                      = []
scaleTransposedDesignMatrix _          _                       []                     = []
scaleTransposedDesignMatrix maybeMeans maybeStandardDeviations transposedDesignMatrix = map scaleVector range'
  where
    scaleValue' :: Maybe Number -> Maybe Number -> Number -> Number
    scaleValue' mm ms e = fromMaybe e (scaleValue mm ms e)
    scaleVector :: Int -> Vector
    scaleVector i = map (scaleValue' (getMaybeMean i) (getMaybeStandardDeviation i)) (getRow i)
    range' :: Array Int
    range' = range 0 (length transposedDesignMatrix - 1)
    getMaybeMean :: Int -> Maybe Number
    getMaybeMean i = fromMaybe Nothing (maybeMeans !! i)
    getMaybeStandardDeviation :: Int -> Maybe Number
    getMaybeStandardDeviation i = fromMaybe Nothing (maybeStandardDeviations !! i)
    getRow :: Int -> Vector
    getRow i = fromMaybe [] (transposedDesignMatrix !! i)

scaleValue :: Maybe Number -> Maybe Number -> Number -> Maybe Number
scaleValue _            (Just 0.0)                unscaledValue = Nothing
scaleValue (Just mean') (Just standardDeviation') unscaledValue = Just ((unscaledValue - mean') / standardDeviation')
scaleValue _            _                         _             = Nothing

unscaleCoefficients :: Array (Maybe Number) -> Array (Maybe Number) -> Vector -> Array (Maybe Number)
unscaleCoefficients [] _  _  = []
unscaleCoefficients _  [] _  = []
unscaleCoefficients _  _  [] = []
unscaleCoefficients
  maybeMeans
  maybeStandardDeviations
  coefficients
  =
  if
    length maybeMeans /= length maybeStandardDeviations ||
    length maybeMeans /= (length coefficients - 1) ||
    containsNothing maybeMeans ||
    containsNothing maybeStandardDeviations
    then []
    else map (\ i -> extractAndApply i unscale) (range 0 (length coefficients - 1))
  where
    maybeMeans' = [Nothing] <> maybeMeans
    maybeStandardDeviations' = [Nothing] <> maybeStandardDeviations
    extractAndApply :: Int -> (Int -> Number -> Number -> Number -> Maybe Number) -> Maybe Number
    extractAndApply index f =
      if
        index < 0 ||
        index >= length maybeMeans' ||
        index >= length maybeStandardDeviations' ||
        index >= length coefficients
          then Nothing
          else f index (fromMaybe 0.0 maybeMean) (fromMaybe 0.0 maybeStandardDeviation) coefficient
      where
        maybeMean :: Maybe Number
        maybeMean = fromMaybe Nothing (maybeMeans' !! index)
        maybeStandardDeviation :: Maybe Number
        maybeStandardDeviation = fromMaybe Nothing (maybeStandardDeviations' !! index)
        coefficient :: Number
        coefficient = fromMaybe 0.0 (coefficients !! index)
    unscale :: Int -> Number -> Number -> Number -> Maybe Number
    unscale 0 _ _ coefficient =
      if containsNothing summands
        then Nothing
        else Just (coefficient - summation)
      where
        summation :: Number
        summation = foldl (\ acc x -> acc + (fromMaybe 0.0 x)) 0.0 summands
        summands :: Array (Maybe Number)
        summands = map (\ i ->
            extractAndApply i (\ _ m s c ->
                if s == 0.0 then Nothing else Just (c * (m / s))
              )
          ) (range 1 (length coefficients - 1))
    unscale _     _ 0.0 _           = Nothing
    unscale index _ std coefficient = if index < 0 then Nothing else Just (coefficient / std)

calculatePressStatistic :: Vector -> Vector -> Matrix -> Maybe Number
calculatePressStatistic []          _            _            = Nothing
calculatePressStatistic _           []           _            = Nothing
calculatePressStatistic _           _            []           = Nothing
calculatePressStatistic regressands coefficients designMatrix = maybeSummation
  where
    predictions :: Vector
    predictions = map (\ regressors -> hypothesis coefficients regressors) designMatrix
    residuals :: Vector
    residuals = map (\ (Tuple y y') -> y - y') (zip regressands predictions)
    hatMatrix :: Matrix
    hatMatrix = fromMaybe [] (calculateHatMatrix designMatrix)
    folder :: Maybe Number -> Int -> Maybe Number
    folder Nothing  _ = Nothing
    folder (Just acc) i =
      if
        isNothing maybeResidual ||
        isNothing maybeTerm ||
        1.0 - term == 0.0
          then Nothing
          else Just (acc + (pow (residual / (1.0 - term)) 2.0))
      where
        maybeResidual :: Maybe Number
        maybeResidual = residuals !! i
        residual :: Number
        residual = fromMaybe 0.0 maybeResidual
        row :: Vector
        row = fromMaybe [] (hatMatrix !! i)
        maybeTerm :: Maybe Number
        maybeTerm = row !! i
        term :: Number
        term = fromMaybe 0.0 maybeTerm
    maybeSummation :: Maybe Number
    maybeSummation = foldl folder (Just 0.0) (range 0 (length regressands - 1))

calculateHatMatrix :: Matrix -> Maybe Matrix
calculateHatMatrix [] = Nothing
calculateHatMatrix designMatrix = xxTxIxT
  where
    xT :: Matrix
    xT = transpose designMatrix
    xTx :: Matrix
    xTx = fromMaybe [] (multiplyMatrices xT designMatrix)
    xTxI :: Matrix
    xTxI =
      case invertMatrix xTx of
        (Tuple (Right i) m) -> m
        _                   -> []
    xxTxI :: Matrix
    xxTxI = fromMaybe [] (multiplyMatrices designMatrix xTxI)
    xxTxIxT :: Maybe Matrix
    xxTxIxT = multiplyMatrices xxTxI xT

standardDeviation :: Maybe Number -> Vector -> Maybe Number
standardDeviation _            [] = Nothing
standardDeviation (Just mean') es = Just (pow base 0.5)
  where
    oneOverLength = 1.0 / lengthNum es
    summation     = sum $ map (\ e -> pow (e - mean') 2.0) es
    base          = oneOverLength * summation
standardDeviation _            _  = Nothing

mean :: Vector -> Maybe Number
mean [] = Nothing
mean es = Just (sum es / lengthNum es)
UI.purs
The src/UI.purs file contains all of the logic to power our user interface—the buttons, graph, and input boxes.
module UI whereHere we define our UI module and implicitly export every function it defines.
import Prelude

import Data.Generic (gShow)
import Data.Foldable (foldr)
import Data.Array (drop, (:), length, head, last, range)
import Data.List.Lazy (replicateM, (!!))
import Data.Maybe (Maybe(..), isNothing, fromMaybe, isJust)

import Control.Monad.Eff.Random (RANDOM, randomRange)

import Control.Monad.Aff (Aff)
import Control.Monad.Aff.Free (class Affable)
import Control.Monad.Aff.Console (CONSOLE, log)

import Halogen as H
import Halogen.HTML.Core (className)
import Halogen.HTML.Events.Indexed as HE
import Halogen.HTML.Properties.Indexed as HP
import Halogen.HTML.Indexed as HH

import LinearRegression (
      runLinearRegressionWithUnscaled
    , calculatePressStatistic
  )

import Plot (PLOT, PlotData, makePlot)

import Utils (maybeNumberToString, stringToMaybeNumber, arrayMinOrMax)
Here we list all of the various imports we will need. Halogen will do the heavy lifting of working with the document object model or DOM. Plot is a module we will write. It provides an application programming interface or API to draw or plot our graph on the page.
type Effects eff = H.HalogenEffects (plot :: PLOT, console :: CONSOLE, random :: RANDOM | eff)Our interface will have to perform various (side) effects that will interact with the “outside world”. We will have to plot our graph, write out to the console, and generate random numbers. You can think of this syntax as “whitelisting” the effects we know we will perform.
type Point = { id :: Int, x :: Maybe Number, y :: Maybe Number }We will define our point data structure as having an id and a x and y coordinate. The Maybe Number type indicates that x and/or y maybe a number or Nothing (empty).
data Query a =
  PushPoint a |
  PopPoint a |
  RemovePoint Int a |
  RandomPoints a |
  UpdatePointCoordinate Int String String a |
  RunLinearRegression a
Our UI will consist of one big component—a coherent element or widget on the page. These “queries” are actions that will change the state or current configuration of our component. Queries could also be requests that return information about our component but we don’t have a need for those.
type State = {
      nextId :: Int
    , points :: Array Point
    , yIntercept :: Maybe Number
    , slope :: Maybe Number
    , pressStatistic :: Maybe Number
    , running :: Boolean
  }
This is our state data structure. It holds all of the configuration for our component.
nextId- the next highest identifier for a new pointpoints- a list of pointsyIntercept- the first coefficientslope- the second or last coefficientpressStatistic- the PRESS statistic indicating how well our model fitsrunning- a flag indicating that we are or are not running the linear regression algorithm- If true, the input boxes cannot be updated
initialState :: State
initialState = {
      nextId: 0
    , points: []
    , yIntercept: Nothing
    , slope: Nothing
    , pressStatistic: Nothing
    , running: false
  }
Here you see the initialState function that returns the beginning state for our component. In other words, this is the state our component will be in when you first load the page.
ui :: forall eff. H.Component State Query (Aff (Effects eff))
ui = H.component { render, eval }
  where
    render :: State -> H.ComponentHTML Query
    render state =
      HH.div_ [
        -- ...
      ]
This is our component. It defines how to render or draw itself based on its current state. The component also defines how to evaluate the queries, or in our case the actions, we listed earlier.
    eval :: Query ~> H.ComponentDSL State Query (Aff (Effects eff))
    eval (PushPoint next) = do
      H.modify (\ state -> state {
              nextId = state.nextId + 1
            , points = newPoint state.nextId : state.points
            , yIntercept = Nothing
            , slope = Nothing
            , pressStatistic = Nothing
          }
        )
      pure next
In this action we push a new point onto the state points stack.
    eval (PopPoint next) = do
      H.modify (\ state -> state {
              points = drop 1 state.points
            , yIntercept = Nothing
            , slope = Nothing
            , pressStatistic = Nothing
          }
        )
      currentState <- H.get
      _ <- H.fromAff (makePlot (makePlotDataFromState currentState))
      pure next
In this action we pop the top off of the state points stack (we remove a point). Since we added a point, we update our plot on the page with this new data point.
    eval (RemovePoint id next) = do
      H.modify (\ state -> state {
              points = foldr (\ point acc ->
                  if point.id == id then acc else point : acc
                ) [] state.points
            , yIntercept = Nothing
            , slope = Nothing
            , pressStatistic = Nothing
          }
        )
      currentState <- H.get
      _ <- H.fromAff (makePlot (makePlotDataFromState currentState))
      pure next
In this query we find a specific point by its id and remove it from the list of points in the state. Since we removed a point, we update our plot on the page with this new data point.
    eval (RandomPoints next) = do
      let numberOfPoints = 10
      xs <- H.fromEff (replicateM numberOfPoints (randomRange (-10.0) 10.0))
      ys <- H.fromEff (replicateM numberOfPoints (randomRange (-10.0) 10.0))
      H.modify (\ state -> state {
              points = map (\ i -> {
                      id: i
                    , x: xs !! i
                    , y: ys !! i
                  }
                ) (range 0 (numberOfPoints - 1))
            , yIntercept = Nothing
            , slope = Nothing
          }
        )
      currentState <- H.get
      _ <- H.fromAff (makePlot (makePlotDataFromState currentState))
      pure next
As a convenience, we can produce a list of random points to rapidly fill the component state with points. As before, we update our plot on the page with the state’s new list of data points.
    eval (UpdatePointCoordinate id key value next) = do
      H.modify (\ state -> state {
              points = foldr (\ point acc ->
                  (if point.id == id then updatePointCoordinateFromString point key value else point) : acc
                ) [] state.points
            , yIntercept = Nothing
            , slope = Nothing
            , pressStatistic = Nothing
          }
        )
      currentState <- H.get
      _ <- H.fromAff (makePlot (makePlotDataFromState currentState))
      pure next
If a user updates a point, we find it in the list and update its data structure based on the input boxes for it in the UI. Once we update the point, we update its position on the plot.
    eval (RunLinearRegression next) = do
      H.modify (\ state ->
          state {
                yIntercept = Nothing
              , slope = Nothing
              , pressStatistic = Nothing
              , running = true
            }
        )
      currentState <- H.get
      let linearRegressionData = dataForLinearRegressionFromState currentState
      let result =
                    runLinearRegressionWithUnscaled
                      linearRegressionData.maxIterations
                      linearRegressionData.maxCost
                      linearRegressionData.learningRate
                      linearRegressionData.coefficients
                      linearRegressionData.regressands
                      linearRegressionData.designMatrix
      let pressStatistic =
                            calculatePressStatistic
                              linearRegressionData.regressands
                              result
                              linearRegressionData.designMatrix
      log' (gShow result)
      H.modify (\ state ->
          state {
                yIntercept = head result
              , slope = last result
              , pressStatistic = pressStatistic
              , running = false
            }
        )
      if isJust (head result) && isJust (last result)
        then do
          currentState' <- H.get
          _ <- H.fromAff (makePlot (makePlotDataFromState currentState'))
          pure next
        else pure next
      pure next
Lastly we come to the most important action where we run our linear regression algorithm on the state’s current points. After that, we run our PRESS statistic algorithm. If everything was successful, we update the state with the results. The results being the only two coefficients (the y-intercept and slope) and the PRESS statistic. Note that we update running as false so the user can begin altering the state’s points again.
Make sure to break out your favorite text editor and copy the following into src/UI.purs.
{-
  (C) 2017 David Lettier
  lettier.com
-}

module UI where

import Prelude

import Data.Generic (gShow)
import Data.Foldable (foldr)
import Data.Array (drop, (:), length, head, last, range, filter)
import Data.List.Lazy (replicateM, (!!))
import Data.Maybe (Maybe(..), isNothing, fromMaybe, isJust)

import Control.Monad.Eff.Random (RANDOM, randomRange)

import Control.Monad.Aff (Aff)
import Control.Monad.Aff.Free (class Affable)
import Control.Monad.Aff.Console (CONSOLE, log)

import Halogen as H
import Halogen.HTML.Core (className)
import Halogen.HTML.Events.Indexed as HE
import Halogen.HTML.Properties.Indexed as HP
import Halogen.HTML.Indexed as HH

import LinearRegression (
      runLinearRegressionWithUnscaled
    , calculatePressStatistic
  )

import Plot (PLOT, PlotData, makePlot)

import Utils (maybeNumberToString, stringToMaybeNumber, arrayMinOrMax)

type Effects eff = H.HalogenEffects (plot :: PLOT, console :: CONSOLE, random :: RANDOM | eff)

type Point = { id :: Int, x :: Maybe Number, y :: Maybe Number }

data Query a =
  PushPoint a |
  PopPoint a |
  RemovePoint Int a |
  RandomPoints a |
  UpdatePointCoordinate Int String String a |
  RunLinearRegression a

type State = {
      nextId :: Int
    , points :: Array Point
    , yIntercept :: Maybe Number
    , slope :: Maybe Number
    , pressStatistic :: Maybe Number
    , running :: Boolean
  }

ui :: forall eff. H.Component State Query (Aff (Effects eff))
ui = H.component { render, eval }
  where
    render :: State -> H.ComponentHTML Query
    render state =
      HH.div_ [
            HH.div_ [
                  HH.div_ [
                        HH.b_ [
                            HH.text "Status: "
                          ]
                      , HH.text
                          if state.running
                            then "Running"
                            else if hasValidPoints state then "Press run" else "Add points"
                    ]
                  , HH.div_ [
                          HH.b_ [
                              HH.text "Y-Intercept: "
                            ]
                        , HH.text
                          if isJust state.yIntercept && hasValidPoints state
                            then "" <> (maybeNumberToString state.yIntercept)
                            else "?"
                      ]
                  , HH.div_ [
                          HH.b_ [
                              HH.text "Slope: "
                            ]
                        , HH.text
                          if isJust state.slope && hasValidPoints state
                            then "" <> (maybeNumberToString state.slope)
                            else "?"
                      ]
                  , HH.div_ [
                          HH.b_ [
                              HH.text "PRESS Statistic: "
                            ]
                        , HH.text
                          if isJust state.pressStatistic && hasValidPoints state
                            then "" <> (maybeNumberToString state.pressStatistic)
                            else "?"
                      ]
              ]
            , HH.div_ [
                HH.button [
                      HE.onClick (HE.input_ PushPoint)
                  ] [
                      HH.text "Push Point"
                  ]
              , HH.button [
                      HE.onClick (HE.input_ PopPoint)
                  ] [
                      HH.text "Pop Point"
                  ]
              , HH.button [
                      HE.onClick (HE.input_ RandomPoints)
                    , HP.class_ (className "randomPointsButton")
                  ] [
                      HH.text "Random Points"
                  ]
              , HH.button [
                      HE.onClick (HE.input_ RunLinearRegression)
                    , HP.class_ (className "runButton")
                  ] [
                      HH.text "Run"
                  ]
              , HH.div_ (
                    map (\ point ->
                        HH.li_ [
                              HH.input [
                                    HP.value (maybeNumberToString point.x)
                                  , HP.placeholder "Input the X Coordinate"
                                  , HE.onValueChange (HE.input (UpdatePointCoordinate point.id "x"))
                                  , HP.disabled state.running
                                ]
                            , HH.input [
                                    HP.value (maybeNumberToString point.y)
                                  , HP.placeholder "Input the Y Coordinate"
                                  , HE.onValueChange (HE.input (UpdatePointCoordinate point.id "y"))
                                  , HP.disabled state.running
                                ]
                            , HH.button [
                                    HE.onClick (HE.input_ (RemovePoint point.id))
                                  , HP.class_ (className "removeButton")
                                ] [
                                    HH.text "X"
                                ]
                          ]
                      )
                      state.points
                  )
            ]
        ]
    eval :: Query ~> H.ComponentDSL State Query (Aff (Effects eff))
    eval (PushPoint next) = do
      H.modify (\ state -> state {
              nextId = state.nextId + 1
            , points = newPoint state.nextId : state.points
            , yIntercept = Nothing
            , slope = Nothing
            , pressStatistic = Nothing
          }
        )
      pure next
    eval (PopPoint next) = do
      H.modify (\ state -> state {
              points = drop 1 state.points
            , yIntercept = Nothing
            , slope = Nothing
            , pressStatistic = Nothing
          }
        )
      currentState <- H.get
      _ <- H.fromAff (makePlot (makePlotDataFromState currentState))
      pure next
    eval (RemovePoint id next) = do
      H.modify (\ state -> state {
              points = foldr (\ point acc ->
                  if point.id == id then acc else point : acc
                ) [] state.points
            , yIntercept = Nothing
            , slope = Nothing
            , pressStatistic = Nothing
          }
        )
      currentState <- H.get
      _ <- H.fromAff (makePlot (makePlotDataFromState currentState))
      pure next
    eval (RandomPoints next) = do
      let numberOfPoints = 10
      xs <- H.fromEff (replicateM numberOfPoints (randomRange (-10.0) 10.0))
      ys <- H.fromEff (replicateM numberOfPoints (randomRange (-10.0) 10.0))
      H.modify (\ state -> state {
              points = map (\ i -> {
                      id: i
                    , x: xs !! i
                    , y: ys !! i
                  }
                ) (range 0 (numberOfPoints - 1))
            , yIntercept = Nothing
            , slope = Nothing
          }
        )
      currentState <- H.get
      _ <- H.fromAff (makePlot (makePlotDataFromState currentState))
      pure next
    eval (UpdatePointCoordinate id key value next) = do
      H.modify (\ state -> state {
              points = foldr (\ point acc ->
                  (if point.id == id then updatePointCoordinateFromString point key value else point) : acc
                ) [] state.points
            , yIntercept = Nothing
            , slope = Nothing
            , pressStatistic = Nothing
          }
        )
      currentState <- H.get
      _ <- H.fromAff (makePlot (makePlotDataFromState currentState))
      pure next
    eval (RunLinearRegression next) = do
      H.modify (\ state ->
          state {
                yIntercept = Nothing
              , slope = Nothing
              , pressStatistic = Nothing
              , running = true
            }
        )
      currentState <- H.get
      let linearRegressionData = dataForLinearRegressionFromState currentState
      let result =
                    runLinearRegressionWithUnscaled
                      linearRegressionData.maxIterations
                      linearRegressionData.maxCost
                      linearRegressionData.learningRate
                      linearRegressionData.coefficients
                      linearRegressionData.regressands
                      linearRegressionData.designMatrix
      let pressStatistic =
                            calculatePressStatistic
                              linearRegressionData.regressands
                              result
                              linearRegressionData.designMatrix
      log' (gShow result)
      H.modify (\ state ->
          state {
                yIntercept = head result
              , slope = last result
              , pressStatistic = pressStatistic
              , running = false
            }
        )
      if isJust (head result) && isJust (last result)
        then do
          currentState' <- H.get
          _ <- H.fromAff (makePlot (makePlotDataFromState currentState'))
          pure next
        else pure next
      pure next

initialState :: State
initialState = {
      nextId: 0
    , points: []
    , yIntercept: Nothing
    , slope: Nothing
    , pressStatistic: Nothing
    , running: false
  }

newPoint :: Int -> Point
newPoint id = { id: id, x: Nothing, y: Nothing }

updatePointCoordinateFromString :: Point -> String -> String -> Point
updatePointCoordinateFromString point "x" s = point { x = stringToMaybeNumber s }
updatePointCoordinateFromString point "y" s = point { y = stringToMaybeNumber s }
updatePointCoordinateFromString point  _  _ = point

dataForLinearRegressionFromState ::
  State ->
  {
      maxIterations :: Int
    , maxCost       :: Number
    , learningRate  :: Number
    , coefficients  :: Array Number
    , regressands   :: Array Number
    , designMatrix  :: Array (Array Number)
  }
dataForLinearRegressionFromState state = {
      maxIterations: 10000
    , maxCost: 1e-11
    , learningRate: 0.05
    , coefficients: [1.0, 1.0]
    , regressands:  map (\ { y: y } ->  fromMaybe 0.0 y ) validPoints
    , designMatrix: map (\ { x: x } -> [fromMaybe 0.0 x]) validPoints
  }
  where
    validPoints = filter pointIsValid state.points

coords :: State -> Array (Array Number)
coords { points: [] }     = []
coords { points: points } = foldr (\ point acc ->
    if isNothing point.x || isNothing point.y
      then acc
      else [fromMaybe 0.0 point.x,  fromMaybe 0.0 point.y] : acc
  ) [] points

getXValuesFromState :: State -> Array (Number)
getXValuesFromState { points: points } = foldr (\ point acc ->
    if isNothing point.x || isNothing point.y
      then acc
      else fromMaybe 0.0 point.x : acc
  ) [] points

makePlotDataFromState :: State -> PlotData
makePlotDataFromState state@{
      points: points
    , yIntercept: (Just yIntercept)
    , slope: (Just slope)
  } = {
      scatter: pointsToScatterData points
    , line: if length xValues > 0
              then [
                    {
                        x: minX
                      , y: slope * minX + yIntercept
                    }
                  , {
                        x: maxX
                      , y: slope * maxX + yIntercept
                    }
                ]
              else []
  }
  where
    xValues = getXValuesFromState state
    minX    = arrayMinOrMax min 0.0 xValues
    maxX    = arrayMinOrMax max 0.0 xValues
makePlotDataFromState state@{
      points: points
    , yIntercept: Nothing
    , slope: Nothing
  } = {
      scatter: pointsToScatterData points
    , line: []
  }
makePlotDataFromState state@{
      points: points
    , yIntercept: (Just _)
    , slope: Nothing
  } = {
      scatter: pointsToScatterData points
    , line: []
  }
makePlotDataFromState state@{
      points: points
    , yIntercept: Nothing
    , slope: (Just _)
  } = {
      scatter: pointsToScatterData points
    , line: []
  }

pointsToScatterData :: Array Point -> Array { x :: Number, y :: Number }
pointsToScatterData []     = []
pointsToScatterData points = foldr (\ point acc ->
    if isNothing point.x || isNothing point.y
      then acc
      else { x: fromMaybe 0.0 point.x, y: fromMaybe 0.0 point.y } : acc
  ) [] points

hasValidPoints :: State -> Boolean
hasValidPoints { points: [] } = false
hasValidPoints state          = (length <<< coords) state > 0

pointIsValid :: Point -> Boolean
pointIsValid { id: _, x: (Just x), y: (Just y) } = true
pointIsValid _                                   = false

log' :: forall a b. Affable (console :: CONSOLE | b) a => String -> a Unit
log' string = H.fromAff $ when debug $ log string

debug :: Boolean
debug = false
Plot.js
To integrate Chart.js, which powers our graph, we’ll need to use PureScript’s foreign function interface or FFI.
Go ahead and copy this into src/Plot.js.
/* global exports */

/*
  (C) 2017 David Lettier
  lettier.com
*/

"use strict";

var Chart = require('../../bower_components/chart.js');

exports.makePlot = (function () {
  var ctx = document.getElementById("pointChart");
  var plot = new Chart(
      ctx
    , {
        type: 'bar'
      , data: {
        datasets: [
          {
              label: ''
            , type: 'scatter'
            , data: []
            , pointBorderColor: '#87FFBF'
            , pointBackgroundColor: '#87FFBF'
            , pointRadius: 7
            , showLine: false
          },
          {
              label: ''
            , type: 'line'
            , data: []
            , fill: false
            , borderColor: '#DC84F4'
            , borderWidth: 5
            , pointRadius: 0
            , showLine: true
          }
        ]
      }
      , options: {
          responsive: false
        , legend: {
            display: false
          }
        , scales: {
          xAxes: [
            {
                type: 'linear'
              , position: 'bottom'
              , gridLines: {
                    color: '#aaa'
                  , zeroLineColor: '#aaa'
                }
              , ticks: {
                    fontColor: '#aaa'
                }
            }
          ]
          , yAxes: [
            {
                gridLines: {
                    color: '#aaa'
                  , zeroLineColor: '#aaa'
                }
              , ticks: {
                    fontColor: '#aaa'
                }
            }
          ]
        }
      }
    }
  );
  return function (data) {
    plot.data.datasets[0].data = data.scatter || [];
    plot.data.datasets[1].data = data.line || [];
    plot.update();
  };
}());
Here we only export one function makePlot. This function takes in the points and draws the graph on the page.
Plot.purs
Back over in PureScript, we connect our PureScript code to our JavaScript code in src/Plot.purs.
Go ahead and copy this into src/Plot.purs.
{-
  (C) 2017 David Lettier
  lettier.com
-}

module Plot where

import Prelude
import Control.Monad.Aff (Aff)

foreign import data PLOT :: !

foreign import makePlot :: forall aff. PlotData -> Aff (plot :: PLOT | aff) Unit

type PlotData = { scatter :: Array { x :: Number, y :: Number }, line :: Array { x :: Number, y :: Number } }

emptyPlotData :: PlotData
emptyPlotData = { scatter: [], line: [] }
Here the major detail is the foreign import makePlot line. You can see that it takes PlotData, performs the plot update (side-effect), and returns Unit (nothing of interest or void). Note that Aff is short for asynchronous extensible effects.
Matrix.purs
Go ahead now and copy the following over to src/Matrix.purs.
{-
  (C) 2017 David Lettier
  lettier.com
-}

module Matrix where

import Prelude

import Data.Ord (abs)
import Data.Foldable (foldl, sum)
import Data.Tuple (Tuple(..), fst, snd)
import Data.Array (head, length, null, range, slice, tail, updateAt, zip, (!!))
import Data.Either (Either(..))
import Data.Maybe (Maybe(Just, Nothing), fromMaybe, isNothing)

type Vector = Array Number
type Matrix = Array Vector

invertMatrix :: Matrix -> Tuple (Either String Matrix) Matrix
invertMatrix matrix
  | null matrix                 = Tuple (Left "Empty matrix")                (identityMatrix (length matrix))
  | not $ isSquareMatrix matrix = Tuple (Left "Not a square matrix")         (identityMatrix (length matrix))
  | containsZeroRowOrCol matrix = Tuple (Left "Contains zero row or column") (identityMatrix (length matrix))
  | otherwise = result
  where
    matrixSize = length matrix
    identity   = identityMatrix matrixSize
    result :: Tuple (Either String Matrix) Matrix
    result = foldl folder (Tuple (Right matrix) identity) (matrixToRange matrix)
    folder :: Tuple (Either String Matrix) Matrix -> Int -> Tuple (Either String Matrix) Matrix
    folder t@(Tuple acc@(Left  _) _) _        = t
    folder t@(Tuple acc@(Right a) b) diagonal =
      if containsZeroRowOrCol a || null a || isNothing maybeDivisorA || divisorA == 0.0
        then (Tuple (Left "Cannot invert") b)
        else (Tuple (Right clearedA) clearedB)
      where
        swapped       = swapWithValidRow (Tuple a b) diagonal
        swappedA      = fst swapped
        swappedB      = snd swapped
        divisorRowA   = fromMaybe [] (swappedA !! diagonal)
        maybeDivisorA = divisorRowA !! diagonal
        divisorA      = fromMaybe defaultMatrixValue maybeDivisorA
        multiplierA   = 1.0 / divisorA
        multipliedA   = multiplyRow swappedA diagonal multiplierA
        multipliedB   = multiplyRow swappedB diagonal multiplierA
        cleared       = clearColumnExceptPivot (Tuple multipliedA multipliedB) (Tuple diagonal diagonal)
        clearedA      = fst cleared
        clearedB      = snd cleared

multiplyMatrices :: Matrix -> Matrix -> Maybe Matrix
multiplyMatrices _  [] = Nothing
multiplyMatrices [] _  = Nothing
multiplyMatrices aMat bMat = if aMatColNum /= bMatRowNum then Nothing else Just cMat
  where
    aMatColNum :: Int
    aMatColNum = foldl (\ acc r -> length r) 0 aMat
    bMatRowNum :: Int
    bMatRowNum = length bMat
    tBMat :: Matrix
    tBMat = transpose bMat
    cMat :: Matrix
    cMat = map (\ r ->
        map (\ c ->
            sum $ map (\ (Tuple a b) ->
                a * b
              ) (zip r c)
          ) tBMat
      ) aMat

defaultMatrix :: Int -> Matrix
defaultMatrix size = buildMatrix size value
  where
    value _ _ = defaultMatrixValue

identityMatrix :: Int -> Matrix
identityMatrix size = buildMatrix size value
  where
    value row col | row == col = 1.0
                  | otherwise  = 0.0

buildMatrix :: Int -> (Int -> Int -> Number) -> Matrix
buildMatrix 0    _ = []
buildMatrix size f = map (\ row -> map (\ col -> f row col) matrixRange) matrixRange
  where
    matrixRange = range 0 (size - 1)

matrixSizeValid :: Int -> Boolean
matrixSizeValid size = size <= maxMatrixSize && size >= minMatrixSize

maybeMatrixValue :: Matrix -> Int -> Int -> Maybe Number
maybeMatrixValue matrix row col = case matrix !! row of
                                    Nothing -> Nothing
                                    Just x  -> x !! col

matrixRow :: Matrix -> Int -> Vector
matrixRow matrix i = fromMaybe [] (matrix !! i)

firstValidRow :: Matrix -> Int -> Int -> Maybe Int
firstValidRow []     _            _     = Nothing
firstValidRow matrix atRowOrBelow inCol = (foldl folder { index: Nothing, value: Nothing} tuples).index
  where
    matrixLength = length matrix
    lastRow = matrixLength - 1
    rowRange = range atRowOrBelow lastRow
    column = slice atRowOrBelow matrixLength (matrixRow (transpose matrix) inCol)
    tuples = zip rowRange column
    folder :: { index :: Maybe Int, value :: Maybe Number } -> Tuple Int Number -> { index :: Maybe Int, value :: Maybe Number }
    folder { index: Nothing, value: Nothing} (Tuple a b) = { index: (Just a), value: (Just b) }
    folder r@{ index: (Just x), value: (Just y)} (Tuple a b) =
      if abs y == 1.0
        then r
        else
          if abs b >= abs y || abs b == 1.0
            then { index: (Just a), value: (Just b) }
            else r
    folder _ _ = { index: Nothing, value: Nothing }

swapWithValidRow :: Tuple Matrix Matrix -> Int -> Tuple Matrix Matrix
swapWithValidRow t@(Tuple a b) diagonal = Tuple a' b'
  where
    row = firstValidRow a diagonal diagonal
    yesSwap = case row of
                Nothing -> false
                Just r  -> r /= diagonal
    swapIfYes m =
      if yesSwap
         then swapRows m diagonal (fromMaybe diagonal row)
         else m
    a' = swapIfYes a
    b' = swapIfYes b

transpose :: Matrix -> Matrix
transpose []     = []
transpose matrix = transpose' matrix []
  where
    transpose' :: Matrix -> Matrix -> Matrix
    transpose' old new = if arrayHasNothing maybeHeads then new else transpose' tails (new <> [heads])
      where
        maybeHeads = map head old
        maybeTails = map tail old
        heads = map (fromMaybe 0.0) maybeHeads
        tails = map (fromMaybe []) maybeTails
        arrayHasNothing :: forall a. Array (Maybe a) -> Boolean
        arrayHasNothing array = case array !! 0 of
                                  Nothing  -> true
                                  (Just x) -> isNothing x

swapRows :: Matrix -> Int -> Int -> Matrix
swapRows []     _ _ = []
swapRows matrix a b = fromMaybe [] (updateRow b rowA (updateRow a rowB (Just matrix)))
  where
    rowA :: Maybe Vector
    rowA = matrix !! a
    rowB :: Maybe Vector
    rowB = matrix !! b
    updateRow :: Int -> Maybe Vector -> Maybe Matrix -> Maybe Matrix
    updateRow i (Just row) (Just matrix') = updateAt i row matrix'
    updateRow _ _ _ = Nothing

multiplyRow :: Matrix -> Int -> Number -> Matrix
multiplyRow []     _   _          = []
multiplyRow matrix row multiplier = map (\ row' ->
    if row == row'
      then map (\ value -> value * multiplier) (matrixRow matrix row')
      else matrixRow matrix row'
  ) (matrixToRange matrix)

clearValue :: Tuple Matrix Matrix -> Tuple Int Int -> Tuple Int Int -> Tuple Matrix Matrix
clearValue (Tuple aMat bMat) pivot@(Tuple pRow pCol) target@(Tuple tRow tCol) = Tuple aMat' bMat'
  where
    pivotRowA :: Vector
    pivotRowA         = matrixRow aMat pRow
    targetRowA :: Vector
    targetRowA        = matrixRow aMat tRow
    pivotValueA :: Number
    pivotValueA       = rowValue pivotRowA pCol
    targetValueA :: Number
    targetValueA      = rowValue targetRowA tCol
    aMat' :: Matrix
    aMat'             = multiplyAndSubtractRows aMat tRow pRow pivotValueA targetValueA
    bMat' :: Matrix
    bMat'             = multiplyAndSubtractRows bMat tRow pRow pivotValueA targetValueA
    rowValue :: Vector -> Int -> Number
    rowValue row col  = fromMaybe defaultMatrixValue (row  !! col)
    multiplyAndSubtractRows :: Matrix -> Int -> Int -> Number -> Number -> Matrix
    multiplyAndSubtractRows
      matrix
      leftSideRow
      rightSideRow
      leftMultiplier
      rightMultiplier
      = map (\ row -> if row == leftSideRow
                        then leftRowValues'
                        else matrixRow matrix row
        ) (matrixToRange matrix)
      where
        leftRowValues  = matrixRow matrix leftSideRow
        rightRowValues = matrixRow matrix rightSideRow
        leftRowValues' = map (\ (Tuple l r) ->
            leftMultiplier * l - rightMultiplier * r
          ) (zip leftRowValues rightRowValues)

clearColumnExceptPivot :: Tuple Matrix Matrix -> Tuple Int Int -> Tuple Matrix Matrix
clearColumnExceptPivot t@(Tuple aMat bMat) pivot@(Tuple pRow pCol) = t'
  where
    t' :: Tuple Matrix Matrix
    t' = foldl folder t (matrixToRange aMat)
    folder :: Tuple Matrix Matrix -> Int -> Tuple Matrix Matrix
    folder acc@(Tuple aMat' bMat') row =
      if row == pRow
        then acc
        else clearValue acc pivot (Tuple row pCol)

containsZeroRowOrCol :: Matrix -> Boolean
containsZeroRowOrCol matrix = containsZeroRow matrix || containsZeroCol matrix

containsZeroCol :: Matrix -> Boolean
containsZeroCol = containsZeroRow <<< transpose

containsZeroRow :: Matrix -> Boolean
containsZeroRow = foldl (\ acc row -> acc || foldl (\ acc' value -> acc' && value == 0.0) true row) false

isSquareMatrix :: Matrix -> Boolean
isSquareMatrix matrix = foldl (\ acc row -> acc && length row == matrixLength) true matrix
  where
    matrixLength = length matrix

matrixToRange :: Matrix -> Array Int
matrixToRange []     = []
matrixToRange matrix = (range 0 (length matrix - 1))

maxMatrixSize :: Int
maxMatrixSize = 10

minMatrixSize :: Int
minMatrixSize = 2

defaultMatrixValue :: Number
defaultMatrixValue = 0.0
Note that we use this module to compute the Hat Matrix used in the PRESS statistic calculation.
Utils.purs
Go ahead and copy the following into src/Utils.purs.
{-
  (C) 2017 David Lettier
  lettier.com
-}

module Utils where

import Prelude

import Global (readFloat, isNaN, isFinite)

import Data.Generic (gShow)
import Data.Array (length, head)
import Data.Maybe (Maybe(..), fromMaybe, isNothing)
import Data.Foldable (foldl)
import Data.Int (toNumber)

firstOrSecondValues :: (Array Number -> Maybe Number) -> Array (Array Number) -> Array Number
firstOrSecondValues f [] = []
firstOrSecondValues f es = foldl innerFold [] (map f es)
  where
    innerFold acc (Just e) = acc <> [e]
    innerFold acc Nothing  = acc

first :: Array Number -> Maybe Number
first [x, y] = Just x
first _      = Nothing

second :: Array Number -> Maybe Number
second [x, y] = Just y
second _      = Nothing

lengthNum :: forall a. Array a -> Number
lengthNum [] = 0.0
lengthNum xs = (toNumber <<< length) xs

arrayNumberHandler :: (Number -> Number -> Number) -> Array Number -> Number
arrayNumberHandler f [x, y] = f x y
arrayNumberHandler _ _      = 0.0

stringToMaybeNumber :: String -> Maybe Number
stringToMaybeNumber s = maybeNumber
  where
    float :: Number
    float = readFloat s
    maybeNumber :: Maybe Number
    maybeNumber = if isNaN float then Nothing else Just float

maybeNumberToString :: Maybe Number -> String
maybeNumberToString Nothing  = ""
maybeNumberToString (Just a) = gShow a

isInfinity :: Number -> Boolean
isInfinity = not <<< isFinite

arrayMinOrMax :: forall a. (Ord a) => (a -> a -> a) -> a -> Array a -> a
arrayMinOrMax _ default []     = default
arrayMinOrMax f _       [h]    = h
arrayMinOrMax f default values = foldl (\ acc value -> f acc value) (fromMaybe default (head values)) values

numberInvalid :: Number -> Boolean
numberInvalid n = isNaN n || isInfinity n

containsNothing :: forall a. Array (Maybe a) -> Boolean
containsNothing xs = foldl (\ acc x -> acc || isNothing x) false xs
These are just a loose collection of functions that provide convenience.
Main.purs
At long last we reach the final PureScript file. This file is the starting point for the logic of the calculator.
Make to sure to copy it over to src/Main.purs.
{-
  (C) 2017 David Lettier
  lettier.com
-}

module Main where

import Prelude

import Data.Maybe (fromMaybe)

import Control.Monad.Eff (Eff)

import Halogen as H
import Halogen.Util (awaitBody, runHalogenAff, selectElement)

import Plot (emptyPlotData, makePlot)

import UI (Effects, ui, initialState)

main :: Eff (Effects ()) Unit
main = runHalogenAff do
  body <- awaitBody
  uiContainer <- selectElement "#uiContainer"
  H.runUI ui initialState (fromMaybe body uiContainer)
  makePlot emptyPlotData
The important detail here is the main function. This is the start of the application (like C/C++’s main).
main accepts and returns nothing. Notice how we whitelist the Effects we defined in src/UI.purs. In procedural fashion, we get the page body and our uiContainer, fire up our UI component, and initialize the plot on the page.
Index.scss
We will need some style so copy this to static/scss/index.scss.
/*
  (C) 2017 David Lettier
  lettier.com
*/

$laptopLWidth: 1440px;
$laptopWidth: 1024px;
$tabletWidth: 768px;

$color1: rgba(51, 55, 69, 1);
$color2: rgba(245, 47, 87, 1);
$color3: rgba(76, 75, 99, 1);
$color4: rgba(175, 190, 209, 1);
$color5: rgba(237, 237, 244, 1);

@mixin laptopL {
  @media (max-width: #{$laptopLWidth}) {
    @content;
  }
}

@mixin laptop {
  @media (max-width: #{$laptopWidth}) {
    @content;
  }
}

@mixin tablet {
  @media (max-width: #{$tabletWidth}) {
    @content;
  }
}


body {
  font-family: sans-serif;
  margin-top:   25px;
  margin-left: 25px;
  background-color: #343438;
  color: white;
  height: 100%;
  line-height: 2;
}
input {
  margin-right: 4px;
  outline: none;
  border: none;
  border-radius: 1px;
  padding: 2px;
  font-size: 20px;
  width: 210px;
  background-color: whitesmoke;
  color: #222;
}
li {
  list-style: none;
  margin-top: 3px;
}
button {
  background-color: #6f6cb9;
  color: white;
  font-weight: bold;
  margin: 2px;
  border-style: none;
  border-radius: 1px;
  outline: none;
  font-size: 20px;
  cursor: pointer;
  -webkit-box-shadow: 0px 3px 3px 0px #190d25;
  -moz-box-shadow:    0px 3px 3px 0px #190d25;
  box-shadow:         0px 3px 3px 0px #190d25;
}
#pageContainer {
  height: 100%;
}
#chartContainer {
  margin-right: 10px;
}
#instructionsContainer {
  margin-bottom: 20px;
}
#uiContainer {
  margin-left: 10px;
}
#logoContainer {
  position: absolute;
  bottom: 0px;
  right: 0px;
  clear: both;
}
#logo {
  width: 250px;
  height: 250px;
  @include laptopL {
    width: 200px;
    height: 200px;
  }
  @include laptop {
    width: 150px;
    height: 150px;
  }
  @include tablet {
    width: 100px;
    height: 100px;
  }
}
.runButton {
  background-color: #00c17c;
}
.removeButton {
  background-color: #f52f57;
}
.randomPointsButton {
  background-color: #4d98c5;
}
.defaultCursor {
  cursor: default;
}
.row {
  display: flex;
  flex-direction: row;
}
Index.html
This is the skeleton of our application. Once our component runs, the markup will change.
Make sure to copy this to static/html/index.html.
<!DOCTYPE html>
<!--(C) 2017 David Lettier-->
<html>
  <head>
    <title>Simple Linear Regression | Lettier.com</title>
    <link rel="stylesheet" href="index.css">
  </head>
  <body>
    <div id="pageContainer">
      <div id="instructionsContainer">
        <h1>Simple Linear Regression</h1>
        <span>Add points by pressing <button class="defaultCursor">Push Point</button>.</span>
        <br>
        <span>
          Remove points by pressing
          <button class="defaultCursor">Pop Point</button> or
          <button class="removeButton defaultCursor">X</button>.</span>
        <br>
        <span>Find the y-intercept and the slope by pressing <button class="runButton defaultCursor">Run</button>.</span>
      </div>
      <div class="row">
        <div id="chartContainer">
          <canvas id="pointChart" width="400" height="400"></canvas>
        </div>
        <div id="uiContainer">
        </div>
      </div>
    </div>
    <script src="app.js"></script>
  </body>
</html>
Build
Now that all of the code is in place, we can build the project and try out the calculator.
Make sure to run the following commands.
cd simple-linear-regression
yarn run buildDist
xdg-open dist/index.html # use `open` if on macOS
The Amazing Beard
With the calculator running, let’s test it out with a made-up scenario.

The Sideshow
Imagine that you are a tax collector. In your country beards are taxed based on their length. One day your boss tells you that The Amazing Beard—a circus performer with a rather large beard—has not paid their taxes for the last 10 years. They ask you to go and collect the back taxes as well as collect the estimated tax for the current year.
You travel to the meet The Amazing Beard and ask to see their beard records going back 10 years.
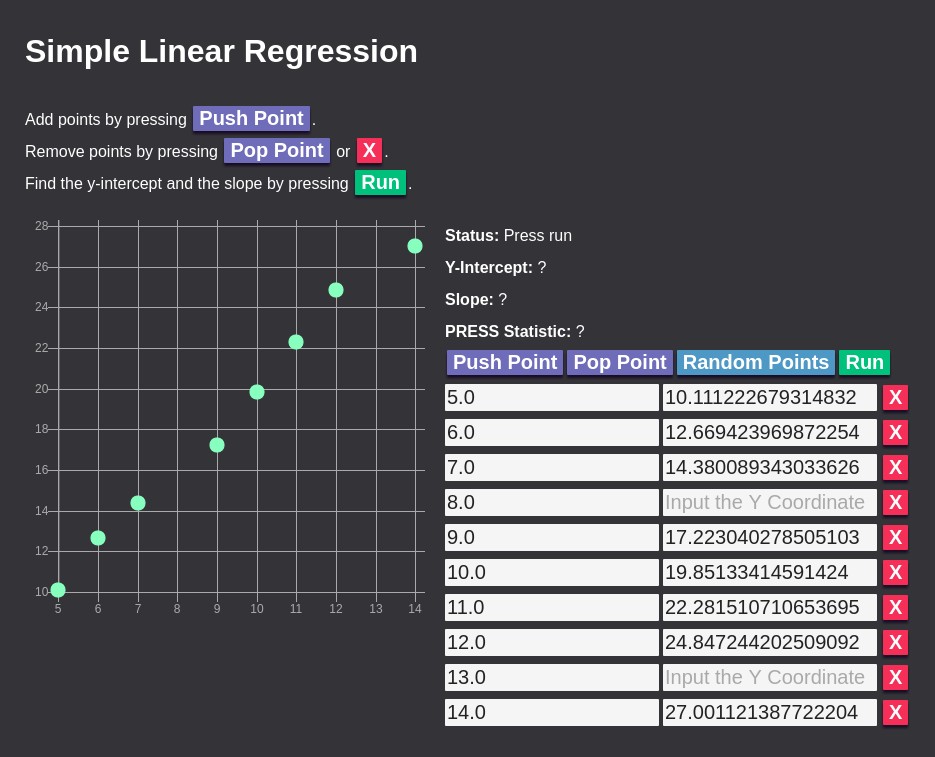
| Year | Beard Length in feet |
|======|======================|
|  5   | 10.111222679314832   |
|  6   | 12.669423969872254   |
|  7   | 14.380089343033626   |
|  8   | ?                    |
|  9   | 17.223040278505103   |
| 10   | 19.85133414591424    |
| 11   | 22.281510710653695   |
| 12   | 24.847244202509092   |
| 13   | ?                    |
| 14   | 27.001121387722204   |
|------|----------------------|
| 15   | ?                    | Current Year
As you search over the data, you notice two of the years are missing. Also, you are not sure what the beard length will be at the end of the current year.
The truth is, the beard actually grows by f(year) = 2 * year + 0 + e where e is random noise in the range [-1, 1]. But you don’t know this—you are only given the data points they recorded. Fortunately, you have the calculator with you.
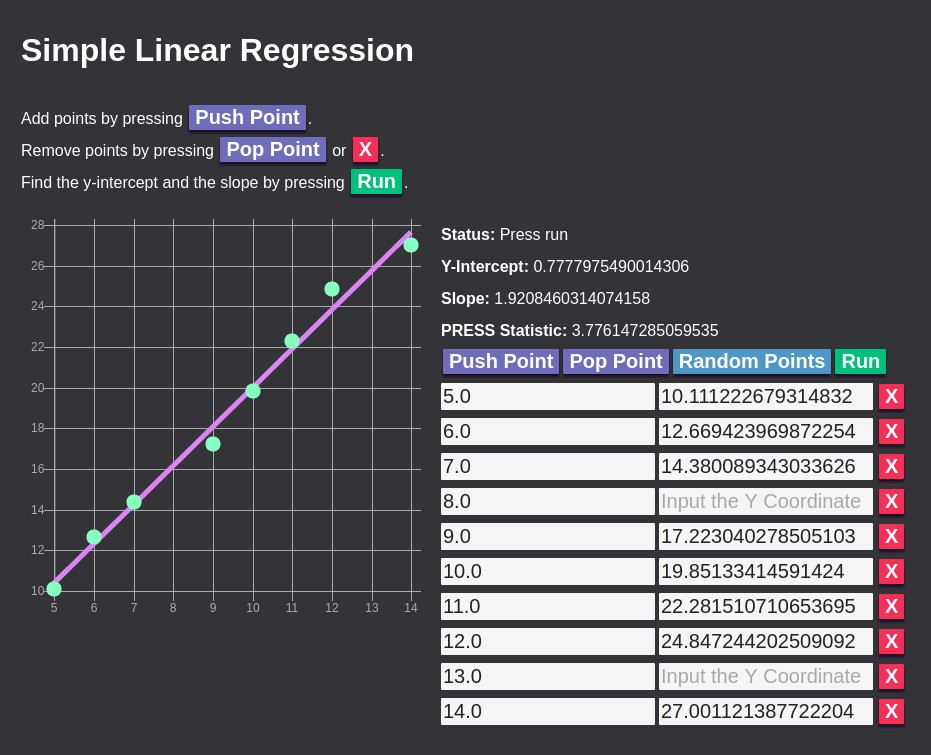
You can see that the fitted model is not perfect but unbeknownst to you, the truth contains noise or irreducible error. Anyway, with your fitted model of f(year) = 1.9208460314074158 * year + 0.7777975490014306, you can now fill out previous years eight and 13 as well as the current year 15. Note that while year 15 is an extrapolation, the PRESS statistic is fairly low.
| Year | Beard Length in feet |
|======|======================|
|  5   | 10.111222679314832   |
|  6   | 12.669423969872254   |
|  7   | 14.380089343033626   |
|  8   | 16.144565800260757   |
|  9   | 17.223040278505103   |
| 10   | 19.85133414591424    |
| 11   | 22.281510710653695   |
| 12   | 24.847244202509092   |
| 13   | 25.748795957297837   |
| 14   | 27.001121387722204   |
|------|----------------------|
| 15   | 29.59048802011267    | Current Year
With the missing data filled in, you collect the owed tax and return to your boss successful.
Recap
From the ground up, we implemented linear regression, gradient descent, and the PRESS statistic. Along the way, we took a look at how each step was achieved in the interactive calculator built with PureScript, PureScript-Halogen, and Chart.js. To test out the calculator, we went through a made-up scenario where we had to both interpolate and extrapolate missing data points.
Now that you’ve seen how linear regression via gradient descent works, take a look at some other machine learning algorithms such as k-Nearest Neighbors and K-Means.